
A slowly changing dimension, a smaller version of concept drifts in master data, occurs naturally in time-series data. Ultimately, slowly changing dimensions of master data are an instance of concept drifts, and not considering them can lead to wrong results in Big Data analytics or impossibilities to learn the right patterns in machine learning and complex event processing. Hence, this article introduces the topic of slowly changing dimensions and what the area of Big Data Science can learn from Data Warehousing.
Concept drifts, master data and slowly changing dimensions
Before we jump into slowly changing dimensions, I want to talk briefly about concept drifts and master data first.
Master data is a set of identifiers and extended attributes that describe core entities. Simple examples for master data are attributes of sensors and addresses of customers.
That’s why concept drifts are said to be a natural occurrence in time-series data.
Meanwhile, master data is said to be stable as it doesn’t experience changes unless something dramatic happens.
If the master data changes, everything changes and this phenomenon of master data change is referred to as “slowly changing dimensions”.
Dimensions in this case refer to classifications for entities like people, products, dates or geographic regions. Imagine the attributes of these master data entities changing slowly.
When a Big Data Stream is stored and aggregated in an Open Source Time Series Database or directly processed by Big Data Stream mining, it is very beneficial when potential master data changes are reflected in the Time-Series storage or in the input stream for the online machine learning model.
Hence, it is absolutely worthwhile for Data Scientists to look at best practices from other areas for dealing with slowly changing dimensions in master data for time series analysis. Gladly, slowly changing dimensions are a well-known topic in Data Warehousing.
But since traditional Data Warehouse modelling is not considered in Big Data science projects, the challenges accompanying slowly changing dimensions in Data Science are often not seen.
Ultimately, slowly changing dimensions are a less complicated instance of concept drifts in Data Science. This makes slowly changing dimensions equally important to knowing concept drifts for Data Scientists.
With that said, a dimension is changing slowly over time instead of regularly and such changes reflected in the historical and current data are managed.
An example of this change is appointing a new head of sales after the old one resigned.
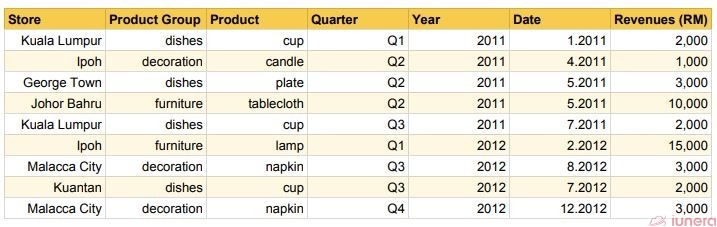
The table below shows the sales of a department store retailer with several stores in Malaysia from 2011 to 2012. This was before the old sales head resigned.
The next table shows the sales of the same retailer’s stores from 2013 to 2014 after the new sales head was appointed.
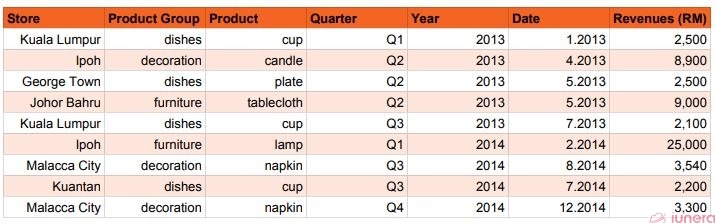
The new sales head contributed to a surge in sales, so the forecasts of future sales would have to be adjusted.
But the problem is there is no indication in these tables about which store the new head has taken over.
So making the adjustment would have been difficult without the data to locate the new head.
Consequently, not adjusting for this change will invite issues for data analysis later on.
This is why concept drifts, including slowly changing dimensions, have to be considered and credited in data analysis.
What are the types of Slowly Changing Dimensions (SCD) actions?
The question is how these changes can be considered.
Like, if the customer changes their address, companies have to decide whether to:
- remove the old address and replace it with the new one or,
- add a new record for the new address on top of the old one.
These are just two of the types of SCD actions. Let’s look at all these approaches.
Type 0: Inaction towards data
Type 0 is known as the passive method where nothing is done to the dimension attribute since its value doesn’t change.
Dimension attributes such as the customer’s original credit score and dates of events are labeled as “original”.
But it’s still hard to believe that Type 0 even exists since it’s about doing nothing.
Type 1: Throwing away historical data
Type 1 is overwriting the old value and replacing it with the new value.
It is easy to maintain as it limits the growth of the dimension to only new records and can often be used for data which changes due to processing corrections (like removing special characters, correcting spelling errors).
However, the old data is lost as no history of dimension changes is kept.
Coming back to the earlier example of change in sales head at one of the retailer’s stores, let’s look at what happens if Type 1 is applied.
An additional table will now include a column for sales heads to show who is in charge of each store (here, we’ll ignore everything else), which would then be added to revenue reports.
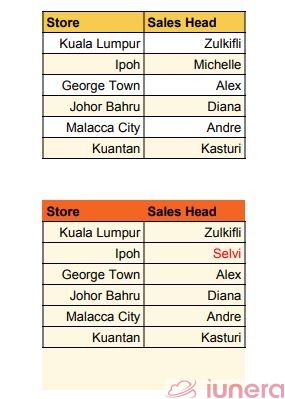
With Type 1, the Ipoh store’s old sales head’s name, Michelle, would be overwritten with the new sales head’s name, Selvi.
Thus, there’s no way to know if Michelle was ever in charge of the Ipoh store’s sales department before Selvi took over.
Type 2: A small horizontal change that makes a big difference
Type 2 is creating a new additional record, also known as row versioning.
When values for a current record change, the old record is marked as “closed” or “previous” and a new/current record gets inserted as a new row with an “opened” or “current” indicator.
Thus, there will be two records associated with this value, enabling the retention of the full history of dimension changes.
Each record contains the beginning and end times to know the time period when the record was active.
Let’s look at the sales head example again with Type 2.
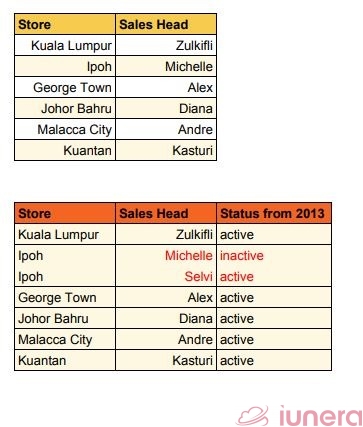
As you can see from the tables, it’s easier to keep track of the sales heads in the Ipoh store when a new row showing Selvi’s status is added below Michelle’s status.
Type 3: A vertical change to see it another way
Type 3 is adding a new column marked as “current” or “new” for the new value, while the old value is pushed into the “old” or “previous” column.
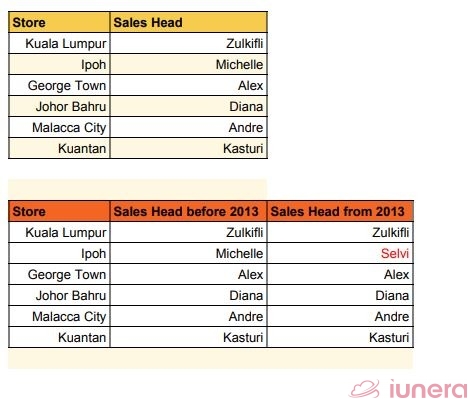
In this example, the Sales Head column was split to show the sales heads before and after the change in sales head at the Ipoh store. One can also add the time period a sales head was active to enable historically accurate reporting.
This is another way of retaining historical data when comparing the current and previous values, but it might need a lot of work if this is done on a larger scale.
Type 4: Rapidly-changing master data dimensions
Type 4 is adding a historical table or a mini-dimension. The reason for this is mainly performance issues in rapid changing masterdata.
In this way, all the dimension’s historical changes can be tracked in a separate table.
Meanwhile, the current data can be kept in the main dimension table without adding a new row or column.
This would help for dimension attribute values that are changing very often.
Noteworthy Hybrid Types
Types 5 and 6 are hybrids of the previous Types.
- Type 5 combines Types 1 and 4 (1+4=5) by embedding a “current profile” mini-dimension key in the main dimension that has been overwritten.
- Type 6 combines Types 1, 2 and 3 (1+2+3=6) by adding a new row as in Type 2, overwriting the current attribute with the new one as in Type 1 and storing the historical data in a historical column as in Type 3.
They combine the basics of SCD actions to reap the benefits of keeping historical data and reporting current data accurately, but they’re complicated approaches.
Summary
Master data is supposed to be unchanging, except in the event of slowly changing dimensions.
A dimension, which describes a perspective for an entity, can experience change over time.
The technique of slowly changing dimensions is very well known in Data Warehousing, so it is often not considered in Data Science or Big Data projects.
But there are several actions that Data Scientists can learn and use from the area of Data Warehousing to capture such slowly changing dimension changes and analyse the data through different perspectives.
For example, Big Data processing chains can overwrite the old values with new values when processing Big Data in real-time or add a new record with a row, column or a separate historical table or apply a mix of these approaches.
What a project chooses to do depends on the organisation’s needs for the historical and current data, and how the changing dimensions will be used.