
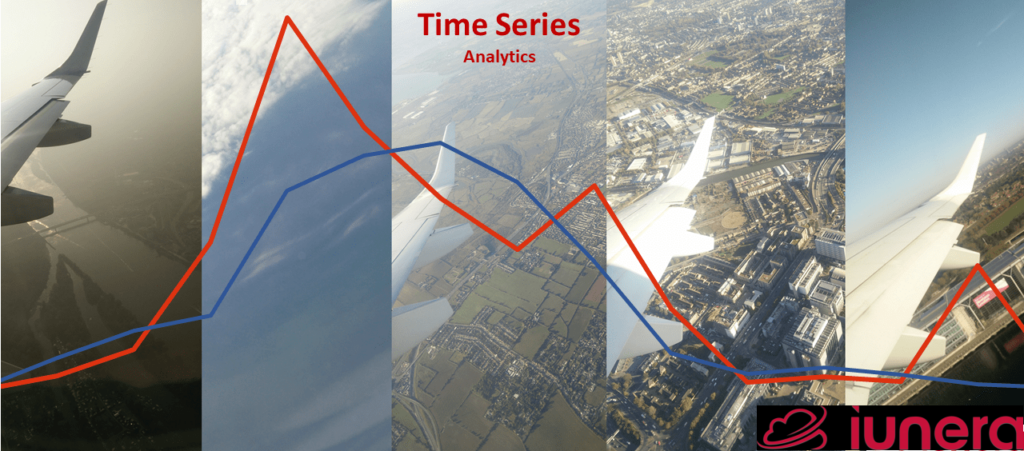
Let’s compare Time Series Data Models to ordinary and more sematic data models. Time Series Data and Time Series Analysis are an additional viewpoint and can answer different analysis questions and open new application possibilities.
In this article you learn:
- What are Time Series Data
- How Time Series Data Models differ from other data viewpoints
- What are examples of typical Time Series Data
- How do concepts drifts and Time Series Data relate
- Why Time Series Analysis matters for Big Data Applications
- Difference to Time Series Data
- Time Series Data are Events Data Streams
- Simple Examples of Time Series Analysis
- Concept Drifts as definition of Time Series Data
- Traditional data models VS Time Series Concept Drifts?
- Business implications of Time Series Viewpoints
- Sum-Up FAQ
- Related Posts
Why Time Series Analysis matters for Big Data Applications
Time Series Data play a special role in Data-Driven Decision Making (DDDM) and Time Series Analysis applications are used within different areas of enterprise Big Data and .
For example, Time Series Data are a foundation to do simple multi-dimensional Time Series Analysis or to generate time series forecasts in machine learning projects.
In detail, processing data in a time series format is the foundation for training forecasting algorithms, doing manual forecasts, anomaly detection, causality and correlation analytics, operational monitoring and alerting.
Often, Time Series Data occur in Big Data volume and therefore Time Series Databases support processing, analyzing and preparing Time Series Data.
Difference to Time Series Data
The goal in Time Series Analysis is to put focus on the time dimension and see records as subsequent events with changing indicators and features.
One example is to create a database model of a blog-post. There, we store different properties of a blog-post such as author or categories. The focus in this blog-post is the semantic model which focuses rather on the “what” than the “when”. It ordinarily is published once and therein there are only minor corrections.
For the Time Series Data, this is different. Imagine you see the records in a database not as the current static values and you focus on the stream of updates (commit log) of these records. Ultimately, you track how often and with which new values the different records in the database is updated.
Therefore, typical Time Series Data are actions, plus indicators (e.g. sensor readings, simple event counts…), which occur at different times; and the focus point of time is the primary factor to consider it a new record, regardless if the old values are merely updated.
With this viewpoint all data which arrives at a new point of time is normally regarded as new dataset which can be compared to other data transmissions at other times.
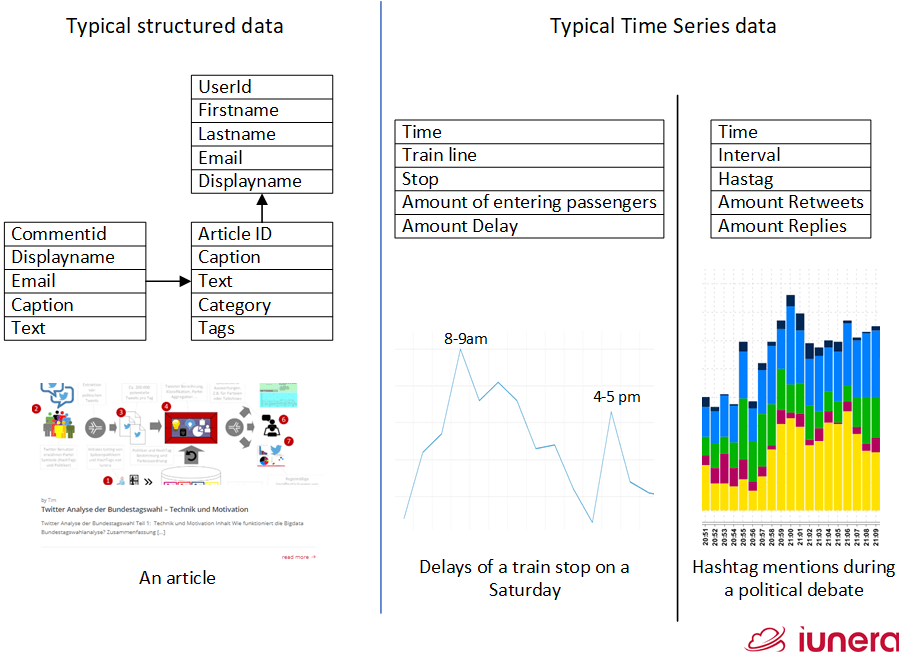
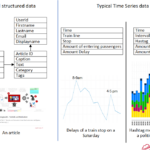
In the following graphic, you can see how a blog-post can be structured in a normal data model. To the left, the data is overridden with each update of the blog-post.
On the right, a typical Time Series Data is shown. We see public transport data where delays of a line and stop change during day, but it is nevertheless important how the delays were in the past.
The same goes for hashtags in a political debate. There, the mentions might change in different time intervals and the main thing which is interesting, is how things evolve over time.
Time Series Data are Events Data Streams
The following picture illustrates these different viewpoint to Time Series Data models on the foundation of SQL insert statements. Ordinary data models would only know the current location of a contact, whereby the time series model focuses on the time axis and keeps track of the changes.
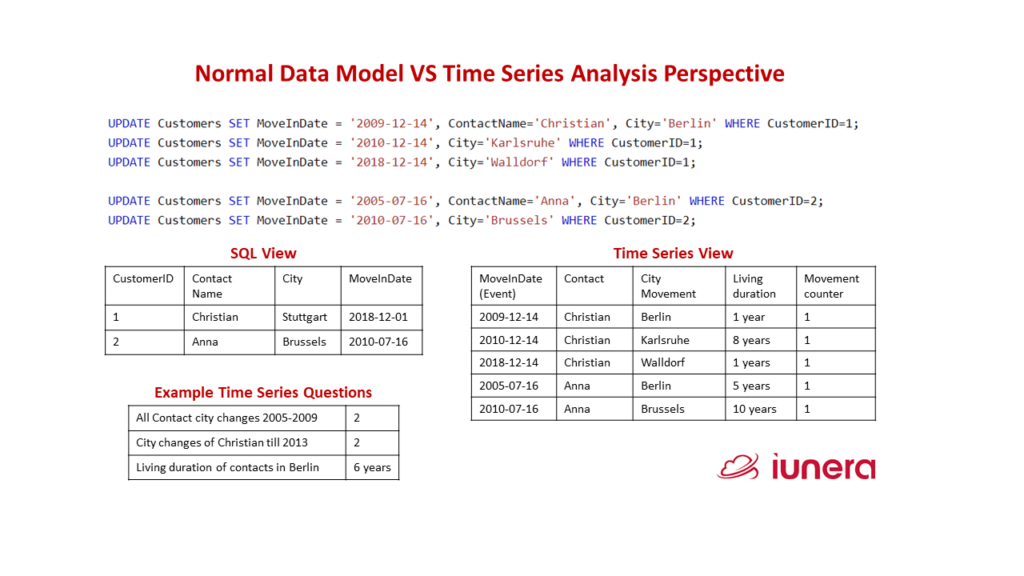
The contact example in this picture is based on a normal relational model. There the update of records is time based, what is not tracked within the normal relational model.
On the right side, we show how a Time Series Data model can represent the update stream of relational models contacts. This enables completely different questions which could not be answered by an ordinary relational data model.
After all, both models have to be seen complimentarily to each other and to answer different types of questions.
Simple Examples of Time Series Analysis
Let us look at the topic of train punctuality. This is inherently a time series use case. There, a Time Series Data model can represent information such as stopping trains. One can aggregate over time which train line is late at which location and/or how many passengers were using the train.
Similarly, one can analyze social media and specify how often a Hashtag in a certain interval (e.g. hour or minute) is used and how many retweets or replies this Hashtag is used during such an interval.
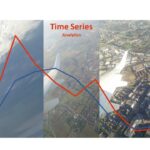
In the following picture, we see Twitter mentions of crypto currencies. You will see that typical investigations are executed and we sum up the most important facts of the nature of Time Series Data.

Concept Drifts as definition of Time Series Data
Time Series Data has the attribute that its underlying concepts drift over time. Hence, if a machine learning researcher investigates a data stream there are concepts beneath this stream, and these concepts drift over time and ultmimately influence the actual data.
For example, a public transport tram will not be late all the time at all days. Instead, there are concepts like a Monday, where it’s the beginning of a workweek – many people enter a specific tram line. These many passengers then causes delay in departures.
On a Saturday, lesser people might take the public transport and it is therefore not late anymore. Thus, the concept drift here are the weekdays and weekend.
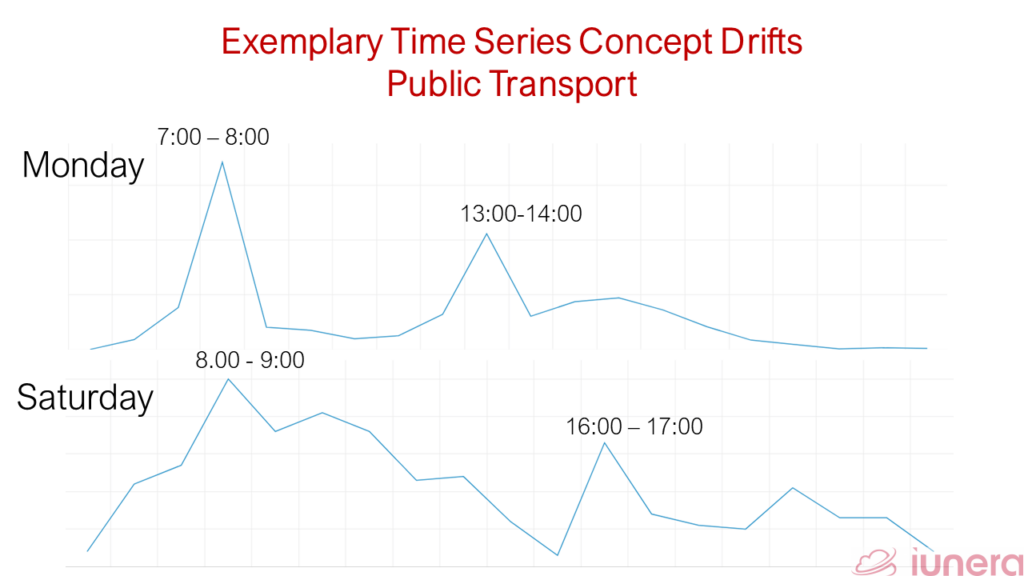
In winter, there can be snow and ice which causes public transport to be late in ways it won’t be in summer. This describes the concept drift of seasons. Such changes in concept drifts normally describes the nature of Time Series Data.
Traditional data models VS Time Series Concept Drifts?
Time Series Data is comparable to an SQL update stream. Let us consider a blog-post article as a typical example for normal data and look at the event data stream of update corrections of this article.
One might say, the definition of underlying concept drifts for updates of a specific blog article violate the concept drift principle, because the dimensions of an article such as the text only changes through minor corrections over time.
However, we argue that an article’s dimensions are not changing, and the revision metadata is the Time Series Data and not the structural model of a single article. In short, this would be the “update time”, and to whom can this be seen as Time Series Data.
All in all, this example shows again that Time Series Data can often be data which is generated while updating normal data, and that can lead to new insights when analyzed.
The general rule of which data model to choose for which data representation and how to align the normal and the Time Series Data model is like the following:
The viewpoint which concepts drift and where the concepts remain largely the same decides which parts of a data model is time series and normally structured. The data with the drifting concepts is for the Time Series Data model and the data which keeps mainly consistent concepts is to be realized in more semantic expressive models.
Business implications of Time Series Viewpoints
We compared Time Series Data to ordinary more sematic data models. Time Series Data is an additional viewpoint and can answer different questions and open new application possibilities.
Thus, Time Series Data do not come alone, are not new and are often connected to old school semantic data models.
Data and Enterprise Architects together with Digitization representatives of departments and IT face the challenge of integrating Time Series Applications with the “old school semantic data models” applications which already exist.
Ways need to be found to process, store or extract the additional Time Series viewpoint.
Time Series Data are cross-cutting tradtional applications and go from social media to infrastructure monitoring and predictive analytics over IoT sensor machine anomaly detection forecasting downto wearable sensor tracking for healthcare use cases.
All Time Series applications use cases can bring plenty of enterprise value and show the necessity that enterprises start thinking about Time Series Data, its storage and utlization.
Enterprises need to determine where and how use cases are related to traditional data models and how they model and integrate or extract the time series components into the Big Data Analysis landscape.
Subsequently businesses face the challenge to select the proper Time Series Database.
Different Time Series Databases offer different features which can be leveraged for the specific Time Series applications. In each case the best Time Series Database for the specific enterprise Time Series application needs to be determined.
Challenging in all Time Series applications is the Concept Drift nature of Time Series Data. Such Concept Drifts can appear out of changes and can render machine learning models such as forecasting invalid, make analytics outdated or lead to other business implications.
Out of this Concept Drift nature, software and business processes how to react when unexpected Concept Drifts appear need to be established and incorporated within the enterprise.
All in all, Time Series Applications mark another end of the age where and application got developed once and then rots while it outdates.
Ultimately, processes for continous monitoring and updates of the Time Series Analytsis project not only in the beginning, but also in the maintenance and live application of the “Enterprise Time Series Application” are needed.
Are you looking for ways to get the best out of your data?
If yes, then let us help you use your data.
Sum-Up FAQ
How Time Series Data models differ from other data viewpoints?
Time Series Data models put focus on the event occurence time as primary dimension. For example, it matters when a record is updated and what the difference to the prior record is whereby relational-transactional data model would just update old records with the new information.
What are examples of typical Time Series Data?
Train delay data; Social media Hastag Mentions; Update metadata of traditional data models.
How concepts drifts and Time Series Data relate
Time Series Data is build on underlying concepts which drift over time. For example, the delays of train differ from weekday to weekend and these concepts then manifest in the data.
Why does Big Data Matter for Time Series Analysis?
Often Time Series Data appears in Big Data volume. Suche Data can be changing sensor readings or delays of public transport. Therefore, Big Data technology needs to be used to execute Time Series Analysis on such a big volume data foundation.
What are examples of Time Series Analysis?
– Analysis which train delay and how many passengers are affected.
– Usage of hastags over time
What is typical for Time Series Data?
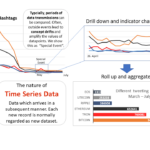
– Periods of data transmissions can be compared
– Coarse grained and fine grained time viewpoints and intervals
– Indicators change based on measurement time
– Time Series Databases store aggregated data for time periods