
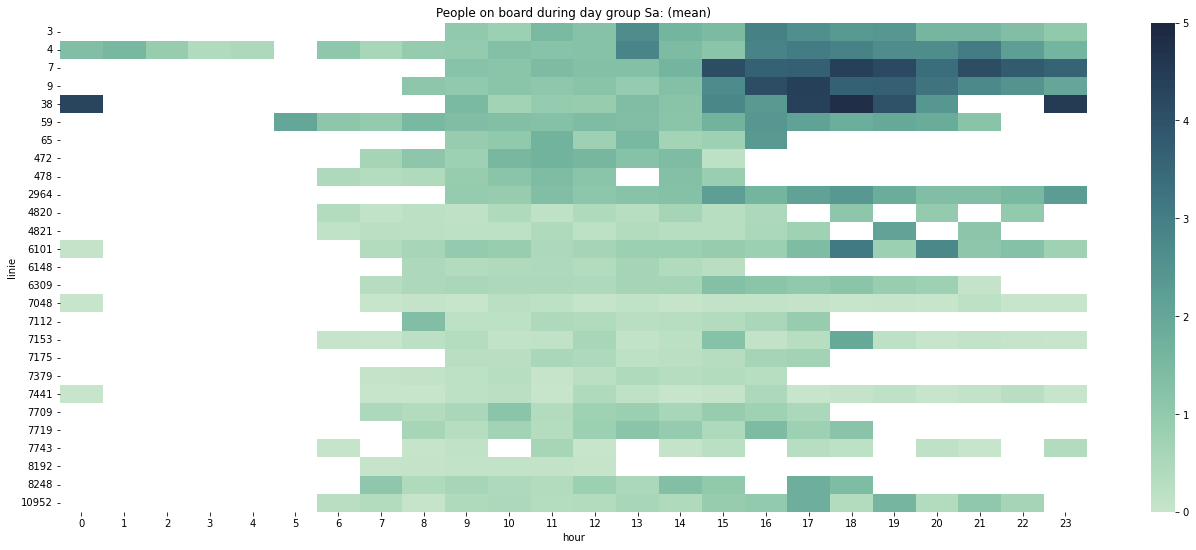
The public transport data sparsity from our previous article led to our attempt in finding more answers using heatmaps to zoom in to the limited data we have.
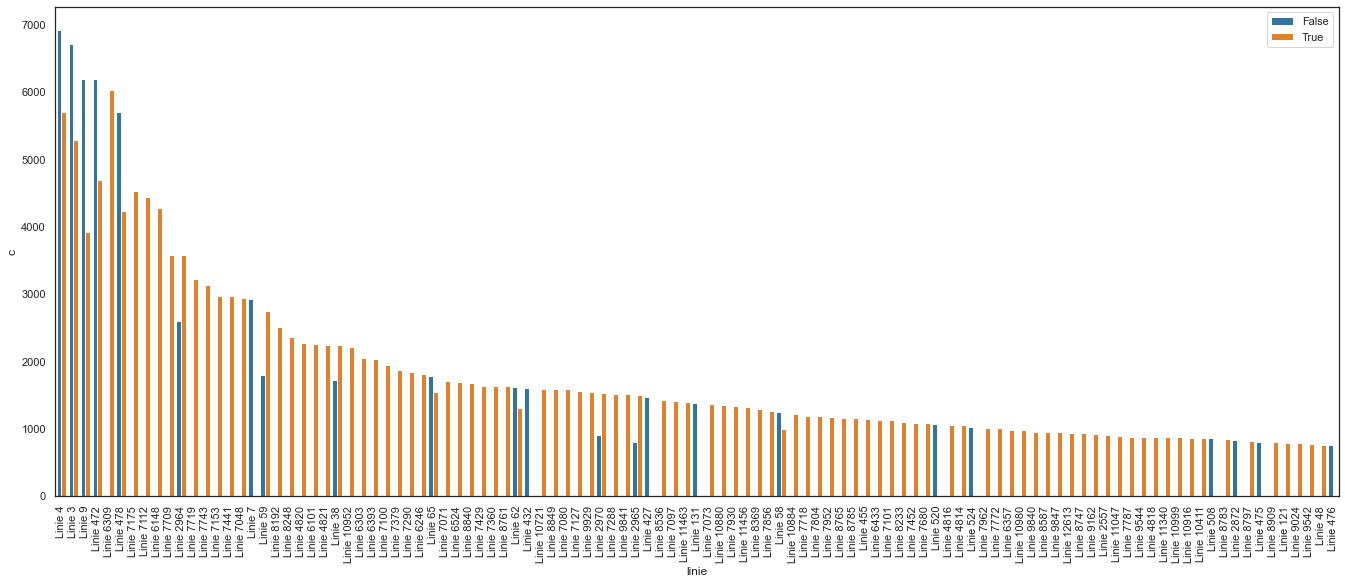
Here's how we familiarised ourselves with the public transport people counting data set we received.
The rising public transport demand can cost time, sanity and safety to left-behind passengers.
Here's proof that it's actually a challenge to find studies that connect occupancy and punctuality in public transport.

Germany's Christmas is set to be different in 2020 as the nation faces an extended lockdown.
The gap between planned arrivals and actual arrivals seems to be a common issue in transport schedules. Log analysis might help us see that.
Why do multimodal public transport associations need to distribute ticket revenue to the multiple operators in charge of the multiple modes of transport?
How long or often does each passenger ride a line or one section of a line? Where does a passenger get in and out?
Since big data can be well-implemented in public transport, what are the first, second and third party data for public transport? This article takes a look.
This article looks at why it makes sense to use sensor data analytics in public transport.