
This post is also available in: Deutsch (German)
The lack of convenience in public transport systems can easily deter people from using it. However, for people without cars, public transport seems to be the only option for people to travel. This leaves them no choice but to go through the stressful, tedious and troublesome experience of commuting by public transport. Luckily, all hope isn’t lost as several countries in East Asia have made huge strides in improving public transport using Big Data. Hence, we look at selected examples of Big Data application in public transport in three East Asian countries, and see what we can learn from them.
The Value of Convenience in Public Transport
A 2014 roundtable report of the International Transport Forum by OECD, Valuing Convenience in Public Transport, explained the importance of convenience in determining the choice between public and private transport.
“In many situations, an increase in public transport convenience reduces the unit costs of travel (euros/dollars per hour or cents per minute) and so provides benefits equivalent to an increase in travel speed.”
Valuing Convenience in Public Transport.
The report listed the key elements of public transport convenience (or inconvenience) according to how significant they are to the commuters’ experience.
- Most important convenience issues for commuters:
- waiting in crowded conditions
- walking in crowded conditions
- walking that involves more than normal levels of effort
- travel time reliability
2. Next most important aspects of convenience:
- walking and waiting in normal conditions
- having to stand while travelling
- travel time and headway between vehicles (travel time of an issue for longer journeys and headway more of an issue for shorter journeys)
3. Two variables that contribute least to convenience:
- the penalty involved in having to interchange
- information provision at stations and stops.
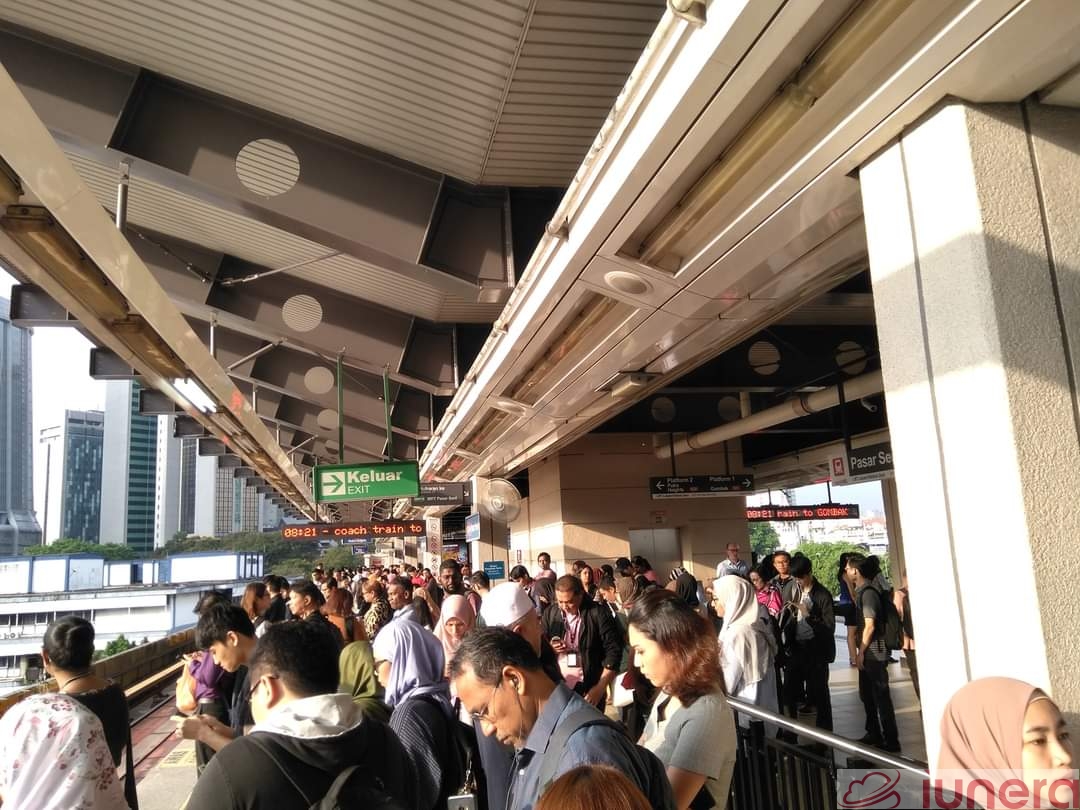
I personally used to dread the daily routine of using the public transport services for the same inconvenience issues stated by the OECD report.
Especially the crowding, where passengers would hardly have the space to breathe or to shift their bodies a little bit to reduce their body aches, let alone manoeuvre to the door or the other side of the coach.
At the same time, pregnant women, senior citizens and passengers with special needs would stand and suffer in silence in the crowded train as all the seats that are meant for them have been occupied by abled people, whose views are blocked by the sea of standing passengers in every nook and cranny of the train.
Other things that make this experience worse are the hot weather, the intolerable behaviour of other public transport users and the occasional catcalls I received during my 10-minute sweat-drenched walks through a dusty tunnel and a dodgy-looking neighbourhood between my former workplace and the nearest train station.
Or, if it rains, I would be dragging my soaking wet shoes onto the platform and into the coach with great discomfort and stench.
Not to forget, the expensive 10-minute cab ride between home and the nearest train station.
It’s no wonder that many people would prefer to drive their own cars instead. If they could afford to, of course.
But enough about my rant as a former public transport user.
Good news is still abound in the public transport realm, particularly in East Asia, where work is being done to integrate Big Data-related technology with public transport systems.
This integration is demonstrated in the three following examples.
1st Example of Big Data in Public Transport: Hitachi’s people flow tech for JR East
Familiar with the severity of crowding in Japanese trains, Hitachi and JR East (a.k.a The East Japan Railway Company) joined forces to employ Hitachi’s people flow technologies in JR East’s transport networks and station buildings.
According to Hitachi’s journal article about this partnership in Hitachi Review, people flow technologies gather, analyse, forecast and simulate the Big Data of the train management system, automatic ticket gate system, surveillance camera footage and other railway infrastructure.
These technologies can then visually represent congestion levels in trains and flows of people walking in station buildings in the greater Tokyo area.
For the congestion levels in trains to be visually represented on a map, the transport network system aggregates and combines train position and passenger number data.
The visual representation map is shown on screens given to the dispatchers who control the train services to allow them to monitor conditions during service disruptions, adjust train headway and make other decisions.
There is also a SCORE system for quantitative assessments of the effects of transport issues on passengers, namely the total amount of time passengers lose.
Passenger movement data is used to calculate the difference between passenger movement time after a transport issue occurred and normal passenger movement time.
For flows of people in station buildings, station staff who manage station passenger safety can check the congestion conditions to manage current congestion and use predictive analytics to reduce future congestion through staff allocation.
An overview of passenger movements throughout a station building can be captured by simulating passenger movement routes using sensors built in train doors and ticket gates as well as surveillance cameras.
The surveillance cameras used for people flow analysis uses a technology known as Eki-Shi-Vision to only extract people movement data and visually represent the people as generic icons to protect their privacy.
Not only is Eki-Shi-Vision useful for the station staff but it also works wonders in informing passengers about their local station’s congestion level through their smartphones to help them make decisions about their travel.
2nd Example of Big Data in Public Transport: Owl Bus’ Routes in South Korea
The Owl Bus refers to the brand name of Seoul’s intra-city buses that run exclusively from 12:00a.m. to 5:00a.m. to cater to the city’s late night commuters.
The idea of the Owl Bus was driven (pun unintended) by the need to “ensure greater convenience and better mobility of the citizens”.
As Seoul’s economy has been expanding in size and scope, the citizens reached a consensus on the need for a bus service that operates from midnight to dawn to support economic activities that run at these odd hours.
Students and workers with low salaries who return home late faced difficulties in finding affordable solutions to ride home after work and always had to pay the late-night extra charge for taxis.
Or worse, there are a lot less available taxis, many of which are driven by taxi drivers who illegally demand extra fares and even refuse passengers.
Thus, the Owl Bus was introduced to solve these problems.
One way Big Data played a role in the Owl Bus is increasing the number of Owl Bus routes to nine using mobile phone data to gauge demand.
Late-night mobile phone call volumes were collected by the Korea Telecom to construct a radial-shape network linking outer districts of the city with the hub areas.
Another way Big Data is used for the Owl Bus is the provision of real-time operation data.
Real-time operation data allows citizens to check the estimated arrival times and locations of the bus in advance through the Seoul Transport Operation and Information Service (Seoul Topis) website or mobile app.
3rd Example of Big Data in Public Transport: Data sharing in Hong Kong
Since the Smart City Blueprint for Hong Kong was introduced in late 2017, over 650 free datasets from over 80 government bureaus and departments have opened up, making progress in data sharing for public transport.
Among the earlier efforts of transport data sharing was the online bus booking platform GoByBus, which seeks to improve cross-boundary bus travel in Hong Kong by consolidating data on bus terminals, routes, stops and updates, and making the data available to bus users.
GoByBus uses Big Data tech to install GPS chip devices on cross-boundary buses for real-time arrival and departure data.
Meanwhile, the Pokeguide app uses Big Data analytics and artificial intelligence (AI) to help users choose the shortest route by listing all the public transport mode combinations and plan their journeys.
“Releasing real-time information of arrival and departure can encourage more people to use public transport. Smart technologies can reduce traffic congestion in such a dense city.”
Co-Founder of Pokeguide, Brian Hui, told China Daily.
Then, on 31st of May 2019, the Hong Kong Transport Department (TD) and the MTR Corporation Limited agreed to open up real-time arrival data on four of MTR’s rail lines in machine-readable format via the Public Sector Information (PSI) Portal to be used by the public and the transport industry.
In addition, launching the real-time arrival data collection system for green minibuses (GMBs) by the end of 2020 is also on the government’s Big Data-driven public transport agenda.
With on-board positioning devices on over 3,300 GMBs, passengers can access the GMB’s real-time arrival data through the PSI portal and the TD’s mobile app, HKeMobility.
Big Data’s Role in Public Transport
In a nutshell, there are plenty of lessons we can gain from these examples.
Like how Big Data can do wonders to managing congestion levels in trains and train stations.
At the same time, Big Data tech can be used and adjusted in ways that still protects the privacy of the people involved.
Radial networks using mobile phone data can also be constructed and leveraged to gauge the demand of mass transport services in cities and meet that demand through expansion of services in terms of time and location.
But the one thing these three examples have in common with each other is that they all provide real-time estimates that enable commuters to make optimal travel decisions based on congestion levels, arrival times, departure times and routes.
This definitely hits the nail on the head in making public transport more convenient to use.
By looking at these examples, we can see that the convenience of using public transport can be upheld and improved using Big Data.
Hopefully, these examples can point other countries with less sophisticated public transport systems to the right direction.