
In the domain of Statistics and Machine Learning, some many different methods and techniques could be used in a separate area of interest. Classification and Regression with Support Vector Machines (SVM) and Support Vector Regression (SVR) is an approach whereby a certain amount of input data is fed into a computer model. The Support Vector Machines (SVM) and Support Vector Regression (SVR) model tries to learn the features of the input data to classify and predict new observations with some form of confidence based on the data that the algorithm is trained on.
The input dataset could vary from images, videos, text, languages, documents, time-series data and so on. These input data are then fed into computer models where specific algorithms are applied to perform the classification and produce an output. In most cases, the outputs will be a vector of probabilities.

Noble classifications algorithms make it possible to perform this. Below listed are some of the popular ones that are commonly used in the industry and researchers in the application:
- Decision Trees
- k Nearest Neighbour (k-NN)
- Artificial Neural Networks (ANN)
- Support Vector Machines (SVM)
- Random Forest
- Clustering
- Binary Tree
- and others
Support Vector Machines (SVM)
Before getting into SVR, let’s understand the basics of how SVM works. SVM is a supervised Machine Learning algorithm that is used in many classifications and regression problems. It still presents as one of the most used robust prediction methods that can be applied to many use cases involving classifications.
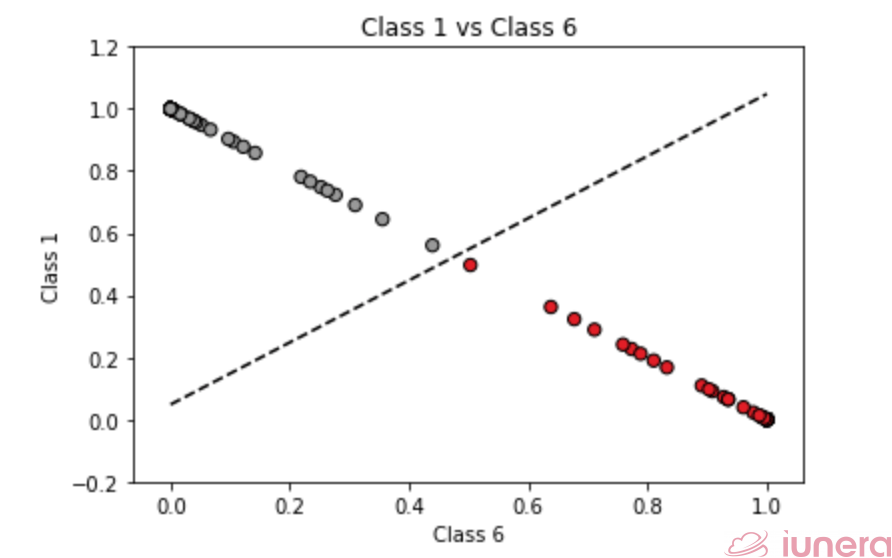
Support vector machine works by finding an optimal separation line called a ‘hyperplane’ to accurately separate 2 or more different classes in a classification problem. The goal is to find the optimal hyperplane separation through training the linearly separable data with the SVM algorithm.
More formally, the algorithm (SVM) creates a hyperplane that is of higher dimensional space (if not linearly separable) which will aid in the classification, outlier detection, regression and so on. A good separation of classes is achieved by having a hyperplane that has the largest distance to the nearest training data points.
Support Vectors
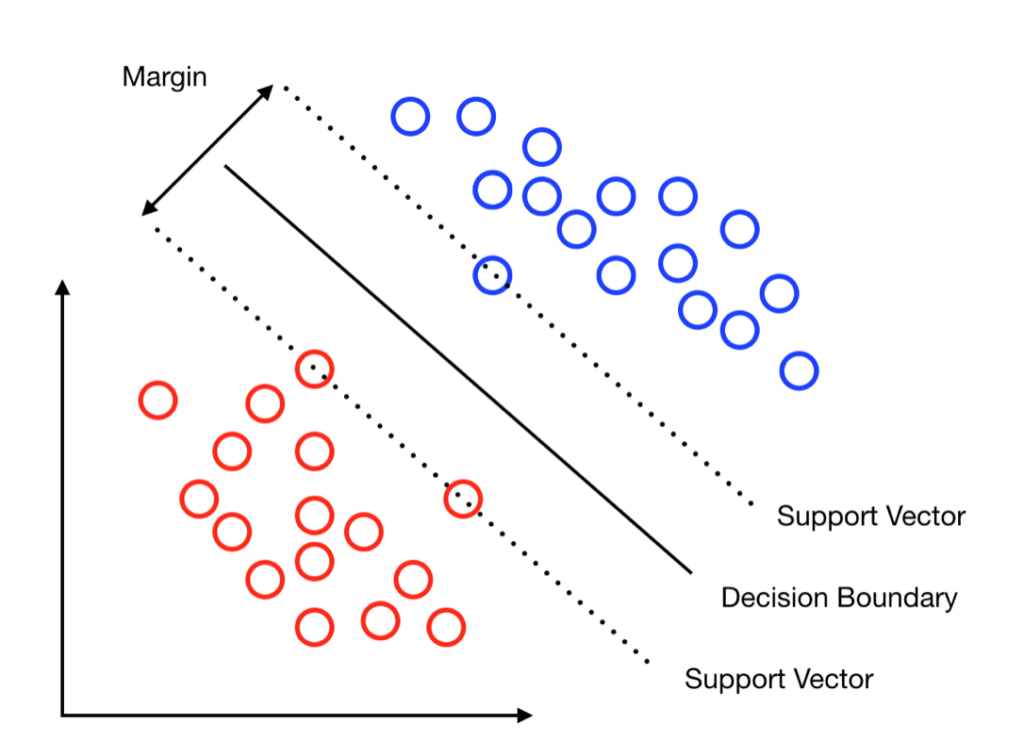
Support vectors, on the other hand, are the points that lie the closest to the hyperplane between the 2 or more classes. These are the data points that are the most difficult to classify. In general, the larger the margin or distance between the support vectors, the easier it is for the algorithm to classify accurately. Hence, once the hyperplane is optimised, it is said to be the optimal separation or the maximum margin classifier.
Linear Classification
Linear SVM can be applied on a linearly separable data. In a linearly separable data, a straight line function can be drawn to separate all the items in class A and class B.
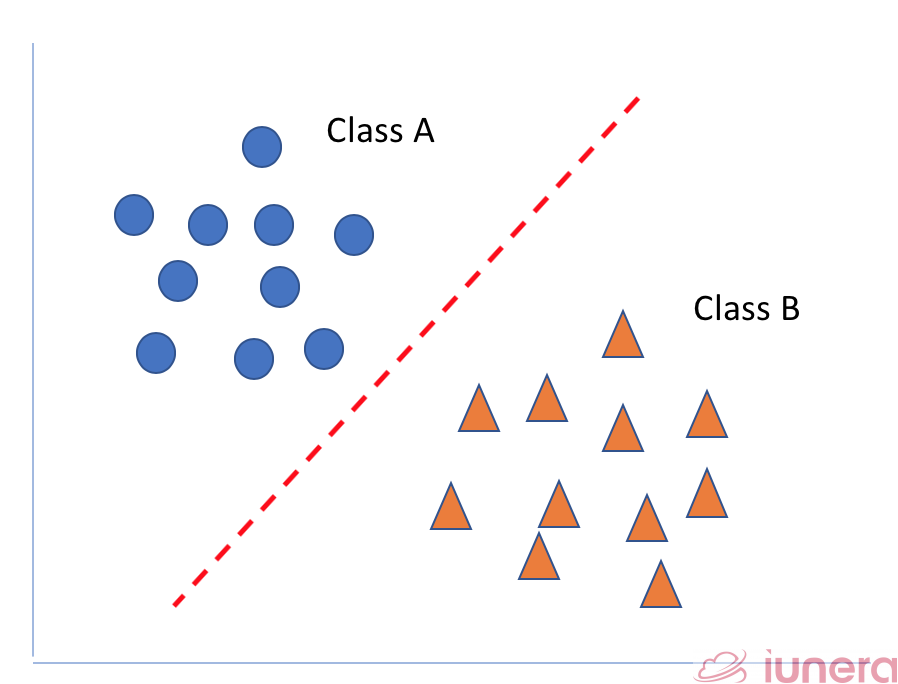
Actually, an infinite number of hyperplanes can be drawn to separate the classes for linearly separable data
This is where the basic idea of SVM comes in play to find out the optimal hyperplane or the maximum margin classifier which is the farthest from the observations.
Non-Linear Classification
What happens if the data that was presented to us for classification is not linearly separable? Now, linearly separable data can be represented in a 1-dimensional plane. But that is not possible with a non-linear data.
The general idea on how to approach this is to map the original feature space to some higher-dimensional space where the training set is separable. Of course, we would want to do so in ways that preserve relevant dimensions of relatedness between data points, so that the resultant classifier should still generalize well.
1. Understanding Kernel Function
Let’s recap what we have seen. In short, an SVM classifier can be solved by computing the convex Lagrange dual of the max-margin SVM formulation (Lagrange multipliers are determined by solving the problem using Quadratic Programming) where is as follows:
For a non-linear data, instead of imagining the original features of each data point, let us first consider a transformation to a new feature space where the data point has N features, one for each support-vector.
Do note that once the kernel function transformation is applied, the original features of the data point are now irrelevant. It is then represented only in terms of its dot products with support vectors (which are basically special data points chosen by the SVM optimization algorithm).
There are a couple of non-linear methods that are called kernel functions or kernel tricks which can be applied to transform the data. It is stated as below.
2. Polynomial Function (PF)
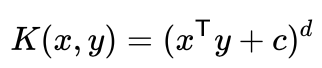
Polynomial kernel not only looks at the features of the linear input data during training to understand the similarity but also learns the interaction features that are present in polynomial regression. A polynomial regression model tries to fit a nonlinear correlation of data between the value of x and the corresponding conditional mean of y.
Polynomial kernels are quite extensively used in Natural Language Processing (NLP). You can read more on this here.
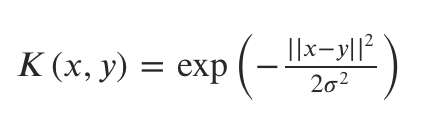
3. Gaussian Radial Basis Function (GRBF)
Gaussian radial basis function is another popular method used in SVM to handle non linear data.
Radial Basis kernel. Source: Quora
Similar to the polynomial function, RBF also performs transformations as shown in the Lagrange equation. The nominator represents the squared Euclidean distance between two data points x and y. Given that it is a Gaussian distribution function, it is computed with the maximum value of which is obtained at the support-vector, and which decays uniformly in all directions around the support vector which leads to round contour like below.
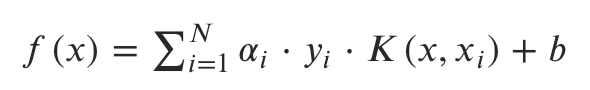
From that point onwards, the classifier is then simply a weighted linear combination of the kernel function computed between a point and each of the support vectors.
With appropriate and optimised use of the parameters, RBF and other kernel functions guarantee a globally optimal predictor which minimises errors in a classifier.
Support Vector Regression (SVR)
Support Vector Regression (SVR) uses mostly all the same principles as the SVM for classification. But there are some minor differences that can be explained.
While SVM is more commonly used for classification, SVR is better practised in regression problems both for linear and non-linear data. SVR has the flexibility to define how much error is tolerable in the model and only then a hyperplane will be trained to fit.
1. Classification
The goal of Classification is to maximise the margin. The inspiration behind maximising the margin is that this will give us a unique solution such that two or more classes can be independently separated. Eventually, our classifier will have separated data points as far as possible from the hyperplane.
2. Regression
The goal of Regression is to find a straight line function f(x) = Wx + B under the condition that the obtained f(x) value is within a certain accuracy (ɛ) of every data point. We want the data point to be as close as possible to the straight-line function.
Conclusion
Classification methods such as Support Vector Machines (SVM), Support Vector Regression (SVR) and more have always been used in Machine Learning, Data Science and other applications. Let it be in the domain of Image, Text, NLP or anything, multiple algorithms could be used, and SVM/SVR is just one of them. Hence, depending on the complexity and use cases, choosing the right algorithm (and simplest) matters to save time and cost ultimately.
Are you looking for ways to get the best out of your data?
If yes, then let us help you use your data.
Where is SVM used?
Support vector machines are most commonly used in classification related problem whereby the algorithm is trained to provide a clear boundary between 2 or more classes.
What are Support Vectors?
Support vectors are simply the points that lie the closest to the hyperplane between the 2 or more classes and also are the most difficult to classify.
How to handle non-linear data in SVM?
For non-linear data, kernel functions or tricks can be applied such as Polynomial, Radial Basis functions.