
This post is also available in: Deutsch (German)
Sustainability with Big Data Science is a big topic. According to our calculations, the garbage produced within 1 month exceeds the average weight of the human body. Big Data Science Applications and intelligent algorithms can support mankind to use resources more efficiently.
Therefore, iunera has been working with TPF Engenharia, the Brazilian subsidiary of TPF Group, to assess the general use of Big Data Science in garbage collection in Recife, Brazil. In this article, we show the first applications of how Big Data Science can help garbage collection.
More specifically, this Big Data project attempted to assess if Big Data can be used to track the movements of rubbish collection trucks, predict when and which rubbish bins need to be emptied and locations of irregular waste.
A big thank you
Right here, we’d like to use this opportunity to thank Eduardo Scalia and José Santos for allowing us to share the insights and use cases.
Ultimately, we all hope this brings the topic of leveraging Big Data in garbage collection forward.
The garbage collection issue
In order to run this Big Data analysis project, we are focusing on three main issues in garbage collection:
- Optimisation of garbage collection truck movement using Big Data
- Forecasting and controlling of rubbish bin fillings and clearance
- Irregular waste prediction and anomaly detection
Truck movement
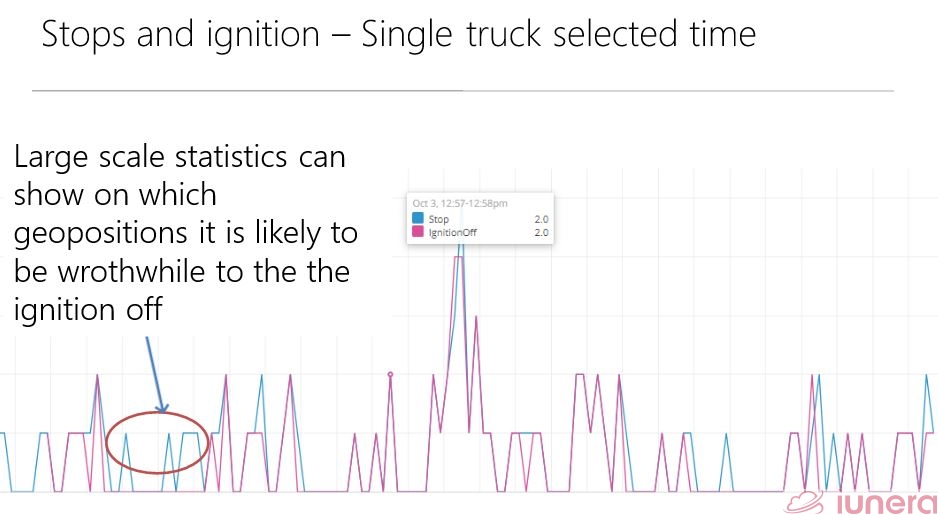
Fuel is costly and a rubbish collection truck’s movement determines the amount of fuel used. It’s obvious that a longer route leads to a larger consumption of fuel, but ignition restarts and idling are also key factors.
When a truck stops, turns off the ignition and then restarts the ignition, fuel is burnt. But idling is worse as idling for 10 seconds burns more fuel than restarting.
These cost money and air quality, of course. We know that money is a limited resource and that air quality gets worse thanks to the greenhouse gas emissions from burning fuel. Especially if that fuel is derived from non-renewable sources, which is usually the case.
So, decisions have to be made regarding when to stop and restart, and when to keep moving.
Sweeping and emptying of rubbish bins
This issue concerns balancing between the street/bin sweeper’s need to empty rubbish bins often – so that the rubbish doesn’t spill over like unattended boiling water – and the sweeper’s frequency in checking the level of rubbish in the bin.
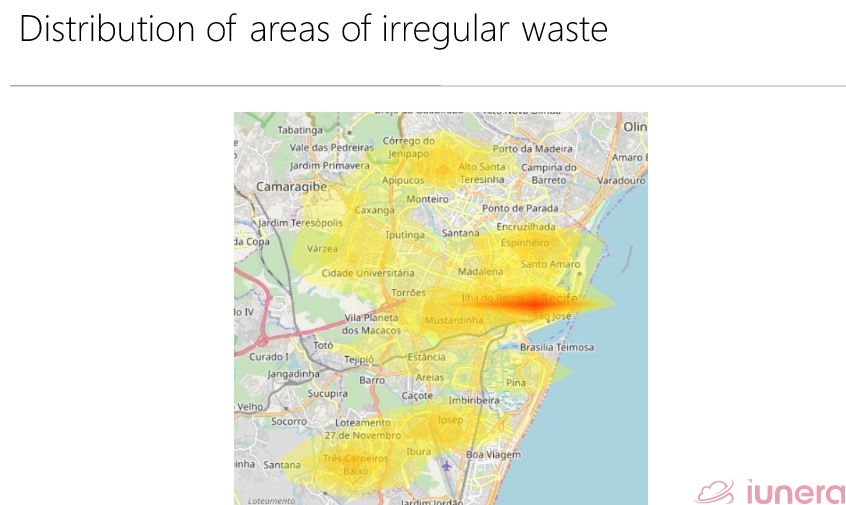
Irregular waste
People love to leave random unwanted items (including mattresses and chairs) outside their homes because they want these items to be collected as trash. Their neighbours would follow suit as well, thinking that it’s a socially (and legally) acceptable practice of waste disposal.
At the same time, there’s also the issue of the trucks not making their collection rounds on a regular and consistent basis, so you can imagine the resultant piles of rubbish.
To illustrate the importance of this project, think of the consequences of leaving irregular waste and overflowing bins unattended or mismanaged. It can be seen in the state of the environment and the health of sentient beings, both human and non-human.
Waste products, which contain harmful toxins, can emit toxic gases, and contaminate soil and water sources, making water unsafe for any use, especially drinking. Waste products are also abundant with germs, so it’s a perfect way of infecting beings with diseases.
Furthermore, scattering waste can also put one’s safety at risk. For instance, a sharp piece of a used glass bottle can poke through someone’s shoe and cut their foot. Ouch!
It’s safe to say that the damage to the environment due to improper waste management can also damage the health and safety of people and animals.
Data-driven optimisation of garbage collection
TPF Group’s role is to help the city of Recife, Brazil to manage and clear their garbage better and more efficiently.
That’s why iunera joined forces with TPF to do an assessment of whether Big Data Analytics can help in minimising costs of garbage collection operations and management.
Two methods were used to do this:
Route analytics
Well-planned truck routes are crucial for an optimally efficient garbage collection round. As I mentioned earlier, we don’t want the fuel and money to go to waste, and pollute the air unnecessarily.
Thus, Big Data’s role here is to process and clean data to evaluate the various options of routes and recommend which routes are the most productive and efficient in the long-run.
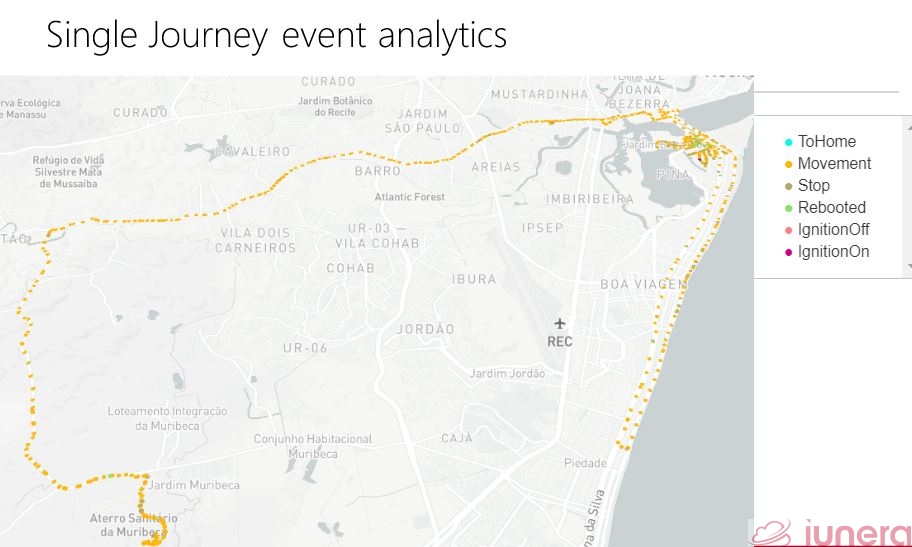
A large volume of truck movement data collected in one year gets aggregated and cleaned to obtain data about the usual duration of movements and stops.
Using this, we can compare the journeys on different days to detect changes over time, and analyse which events take the most time due to efficiency bottlenecks and detect problematic hotspots of events.
Optimised route suggestions can then be generated to lower operation costs and increase efficiency. Yay!
IoT geo-spatial cost intelligence
Different parts of a city generate different cleaning costs. Knowing cost distributions is crucial for planning, controlling and achieving the best cleaning results (and cost savings, of course).
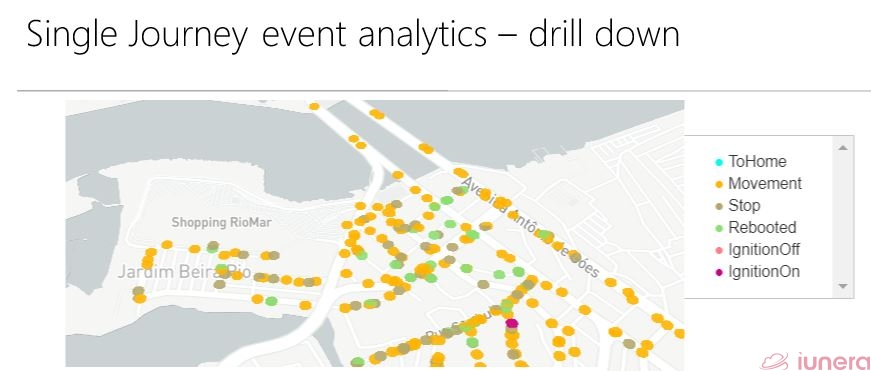
Big Data technology opens up opportunities to combine operational truck movement data with costs. One year of operational truck movement sensor data is aggregated, cleaned, filtered and combined with data about staff, vehicle costs, location of waste, etc to compute cost distribution heat maps.
These combinations of different data sources and visual analytics enable advanced drill downs to uncover potential cost savings and optimisation more easily.
A Big Data-driven cleanup for A Big Mess
During the analysis, we recognized that more scenarios to optimise garbage collection use cases are possible, so more insights can be generated.
However, we already found some operation optimisation opportunities from the analysis of truck movement and irregular waste detection:
- Detect average stop duration at certain spots to make recommendations to turn off the ignition at the right places, detect irregularities and forecast trends.
- Get insights about which areas take the most time and effort to clean.
- Check if areas are skipped.
As for bin cleaning, it’s suggested that, when the worker sweeps around the bin, the worker can monitor the level of rubbish at that particular moment and also take note of how quickly the bin has filled up.
Alternatively, sensor data can be used to detect whether the rubbish bins are full and need to be emptied. It can also help with forecasting when the bins are likely to become full, so that cleaning can be scheduled in advance.
Machine learning can be fed with data on how full the rubbish bins were and when. Subsequently, this time-series data of rubbish-bin filling status can be used as a foundation for machine learning forecasts.
A sweeper then only has to visit the bins when the machine learning forecasts tell the sweeper to do so. Each time the sweeper visits the bins, the machine learning can be updated. All in all, the work gets done with less effort.
Wrapping up what we’ve gathered, the results show that there are several use cases in garbage collection which can gain from data analysis in terms of profit maximisation (thanks to cost reduction) and the streamlining of operations.
We see that Big Data-driven analysis ultimately helps to save resources when we clean up the big mess that we humans create ourselves each day. Not taking advantage of Big Data Science for cleaning up garbage is to let it all go to waste.