
Written by Natasha
The airline industry faces an unprecedented challenge like never before. Let’s take a look at the 5-step approach of how airlines can use Big Data analytics to determine and aid in developing an effective Coronavirus economic recession and Covid- 19 airline recovery plan.
Big Data science – An overview
Big Data analytics is the science of tracking and analyzing huge and vast data – data sets that are too large or complex to be dealt with by traditional data-processing methods, in order to produce fundamental and crucial insights. In the simplest essence, the goal of Big Data analytics is to turn data into information and information into insight.
The industry of Big Data analytics is nothing new and has captured the support of a wide range of organizations, with a global market projected to reach approximately $40.6 billion by 2023, growing at a compound annual growth rate (CAGR) of around 29.7 per cent according to MarketResearch.com.
The market is driven by organizations realizing the operational advantages of Big Data analytics in improved DDV empowering organizations to better target consumers, increased access to cloud-based models, enterprise-grade security and data governance solutions offered by market vendors, and continued vendor consolidation.
For businesses, the use of Big Data analytics and tracking contribute largely to gain competitive advantages in sales and marketing operations as well as to be better prepared to handle upcoming events – especially in tumultuous and unpredictable times such as now.
How can Big Data analytics and tracking help in Covid-19 airline recovery?
The covid-19 pandemic has no doubt wreaked havoc across the globe – and at the epicentre of this chaos is the airline industry. During this crucial and uncertain time for airlines, data is the key to unlocking an effective Covid-19 airline recovery plan.
The pandemic is constantly evolving with new developments and reports emerging by the hour. Rising and falling infection cases, travel restrictions and unprecedented quarantining of countries with tens of millions of people are the root cause behind the airline industry downfall.
Big Data Analytics is highlighting how new data sources and technological advancements can aid airlines in identifying and responding to the Coronavirus outbreak implications.
Monitoring the real-world impact and concept drifts of the virus on airline customer behaviour and future course of Covid-19 through Big Data analytics allows for airlines to plan better and prevent further damage to the already-wounded industry.
The 3 golden questions –
- How,
- When,
- and Where
should airlines focus and re-activate operations? The answer to these lies within the data.
For an effective airline recovery plan to combat this unprecedented scenario, airlines cannot and should not rely on guesswork, assumptions, or opinions. Airlines need foolproof data analytics to make calculated and precise data–driven decisions that answer these crucial questions if they hope to survive and recover effectively.
Through Dynamic Big Data analytics dashboards, airlines will be empowered to monitor global and individual country’s COVID-19 infection escalation and recovery progress along with flight demand to identify and predict the best course of actions in terms of at which point, at which rate and how operations can shift back into activating and motivating flying in and between different regions/countries.
Not all countries have been affected equally by the COVID-19 outbreak hence the flexible Big data systems combined with Data Science methods will enable data to be sliced and diced to get insights into different aspects of different countries comparing different data points which further provides important insight points in aiding Covid-19 airline recovery.
Use case: Airline “#newNormal” tracking dashboard
Let’s take an overview look at the primary use case scenarios of how Big Data analytics can aid Covid-19 airline recovery; Coronavirus airline impact analytics.
Big data science will enable you to be empowered with an all-inclusive data analytical dashboard that will combine all 5 of the below-discussed data sources and any other sources you wish to incorporate. This all-in-one tool is an information powerhouse that will fuel your Covid-19 airline recovery and beyond.
Step 1- Tracking global pandemic progress & recovery
The Big Data Analytics dashboard will provide real-time data tracking of worldwide cases. Airlines can utilize this information to determine the pandemic pathway at a global scale; does the data indicate it is on the path to recovery or is the severity still rising?
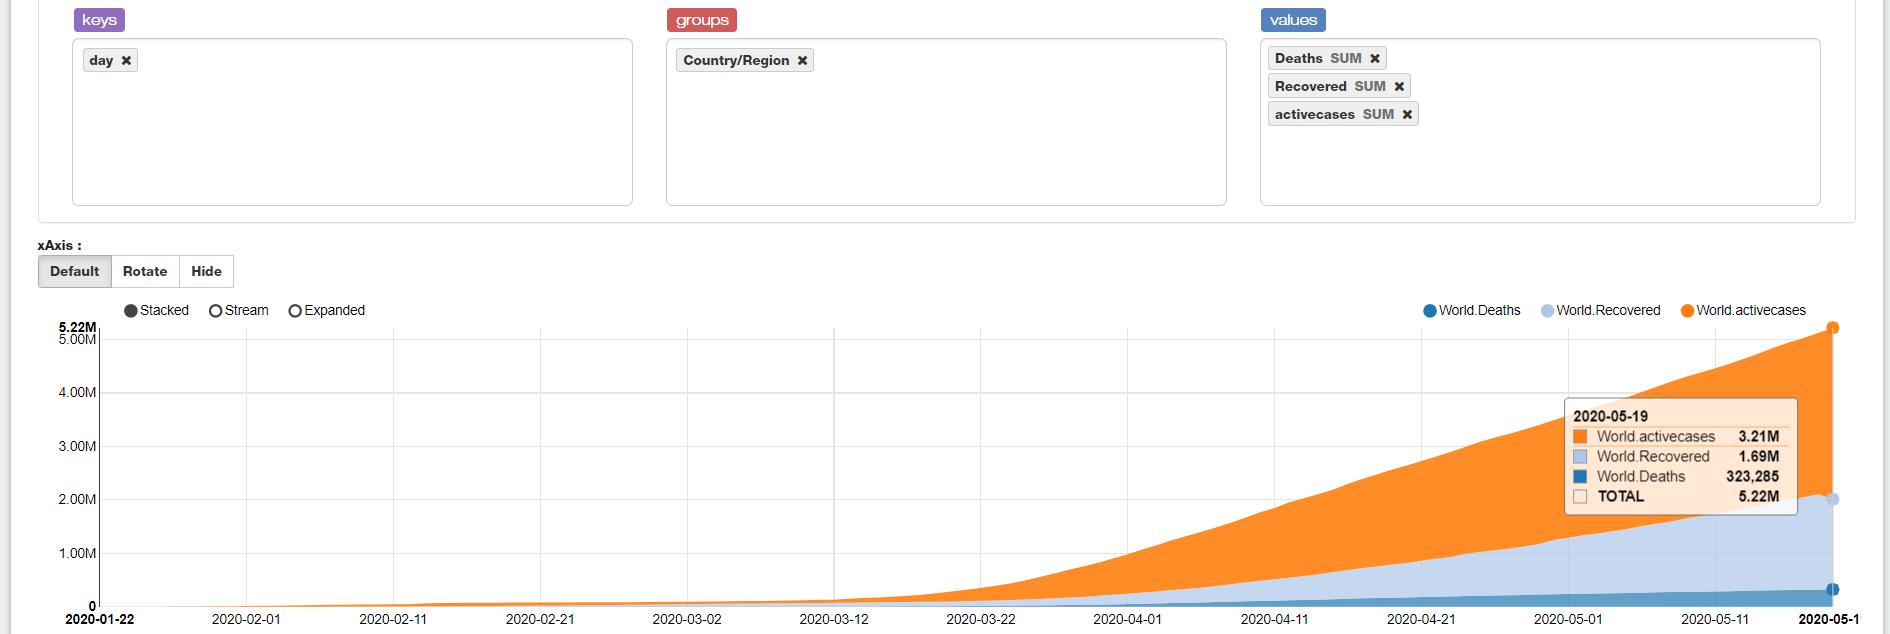
As demonstrated above; the data analytics point out that the pandemic severity is still very much present at a global scale as of 19th of May 2020. The active cases are steadily rising and recovery has much to catch up on to close the gap and establish normalcy.
Given this data, airline must proceed with caution and adapt necessary processes to help contain the pandemic.
Step 2 – Tracking regional and sub regional recovery
Data analytics will provide the capabilities to monitor and gain a microscopic view into precision data of regional, sub-regional and individual country progress and outlook. These detailed insights help determine and showcase the severity of the outbreak in each individual geolocation at any given time.
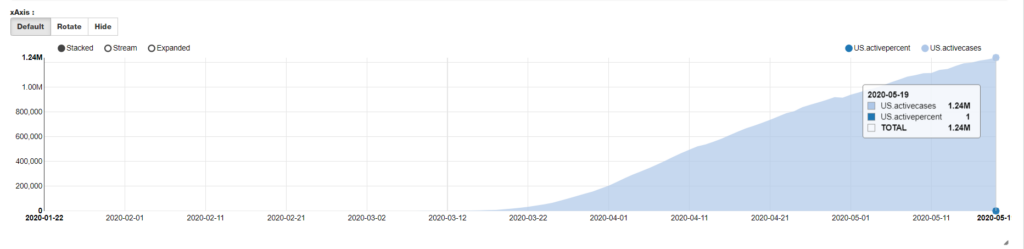
As demonstrated above, the United States as of 19th May 2020 does not show to be in the path of recovery yet. Active cases rate is shown to be gradually rising to display an active sum per cent of 1 – the highest ranking in terms of severity.
With this Data Science, airlines can conclude that infectious severity case is high in the United States and therefore expect air travel to not resume anytime soon in and to the country.
Step 3 – Identifying air route reactivation
By comparing each country’s progress against one another, airlines can determine where to shift their focus in terms of which routes can be activated first.
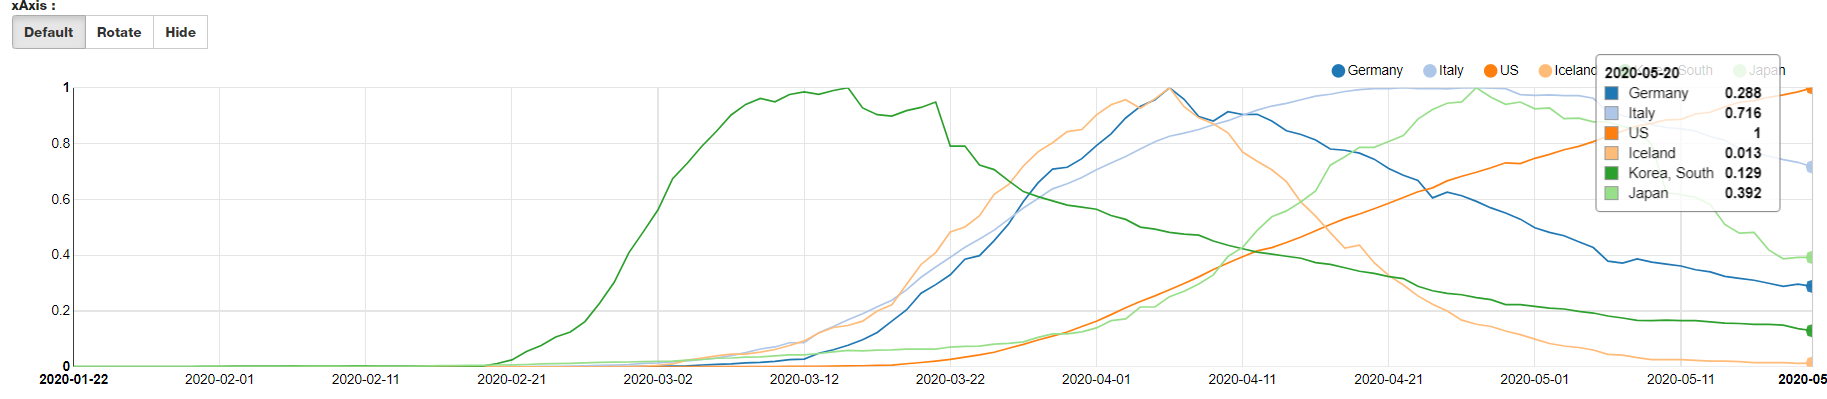
The data analytics above demonstrates and compares the pandemic progress in 6 different countries; Iceland, Japan, South Korea, the US, Italy and Germany.
Out of this comparison, airlines can note that South Korea and Iceland are on track with effective containment displaying the active sum rates of 0.129 and 0.013 respectively; which means airlines can expect that air-travel routes between these two countries will resume sooner compared to the others.
The primary focus of the Covid-19 airline recovery route activation can then be shifted to preparing necessary processes in reactivating this route before the others.
Step 4 – Global air travel demand tracking
Once you identify when and where air travel can be activated. the next crucial step is identifying how to approach these scenarios in terms of marketing and sales.
If the United States is identified to be on the path to Covid-19 recovery; which cities and countries are people looking to travel to the most? Which destinations will have the highest flight demand?
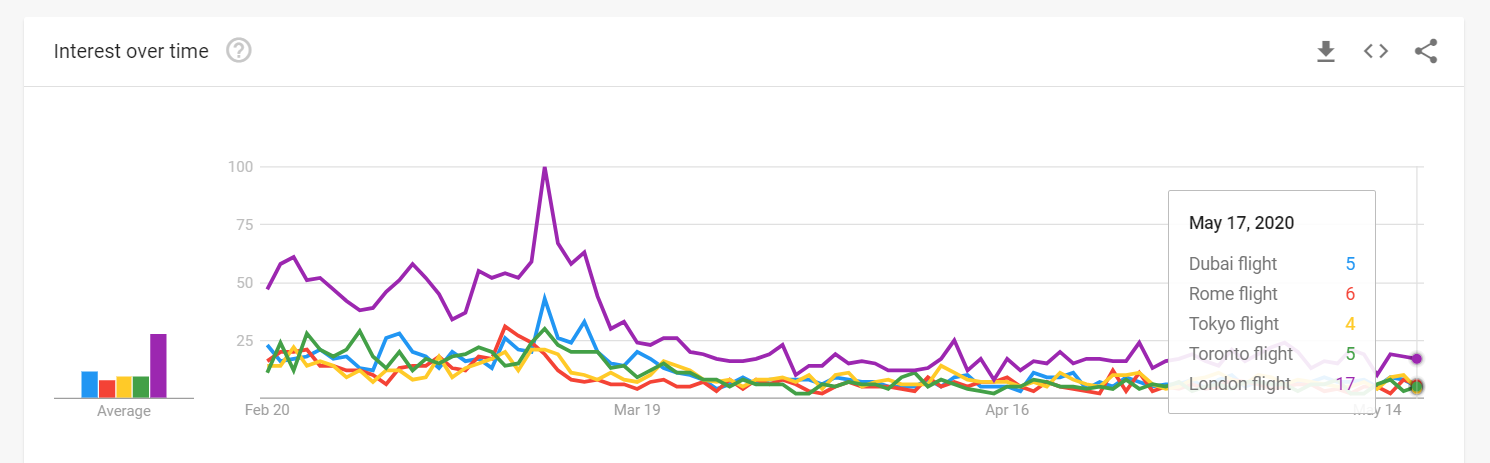
The above graph showcases the approximate flight demand from the United States to the 5 chosen cities; Dubai, Rome, Tokyo, Toronto and London. According to this data, it is visible how flight demand has continued to fall to all 5 destinations during the pandemic with London having maintained to be the city with the highest flight demand as of 17th May 2020.
However; once air travel inches closer to resuming; airlines can utilize this data analytics to determine approximately the highest and lowest flight demand information.
Marketing, sales and operational focus can then be directed to attending and nurturing these routes primarily.
Step 5 – Customer specific air travel demand tracking
To get an even more relative and precise insight into air travel demand, airlines can combine Big Data analytics of the Coronavirus outbreak against their own e-commerce customer behaviour to truly understand what their customers are looking for.
As demonstrated in the previous flight demand graph, airlines will be able to see the flight demand of all routes they operate based on their customers’ online behaviour.
This is the most solid form of data analytics that will aid greatly in the processes of marketing and sales; especially in the digital space. Airlines will be able to identify and directly target the customer segments with marketing activities to re-motivate flying among their customers.
Conclusion
As expressed by Author and American Management consultant Geoffrey Moore, ‘Without Big Data analytics, companies are blind and deaf, wandering out onto the web like deer on a freeway’ – this has never been more true than right now for the airline industry.
The use of Big Data analytics will provide airlines with ample information necessary for executing effective decisions. With the step by step data analytics of the Covid-19 progress, flight demand fluctuations and customer behaviours provided above, airlines can get key insights into where, when and how to reactivate air travel operations.
Operating on assumptions and opinions will only lead to further damage to the dwindling health of airlines. Data-driven precise decision making is essential and crucial for an effective Covid-19 airline recovery plan.
For an example demonstration of the #NewNormal data analytics dashboard, take a look at Covid-19 Airline Recovery Analysis – Airline reactivation analytics.
Are you looking for ways to get the best out of your data?
If yes, then let us help you use your data.