
This post is also available in: Deutsch (German)
We use water for so many purposes: drinking, cooking, cleaning, bathing, brushing teeth, gardening, washing cars, cooling engines, wiping windscreens and so many more. However, water is a scarce resource, let alone water that is clean enough to use safely.
“Nearly 97% of the world’s water is salty or otherwise undrinkable. Another 2% is locked in ice caps and glaciers. That leaves just 1% for all of humanity’s needs — all its agricultural, residential, manufacturing, community, and personal needs.”
Environmental Protection Agency (EPA)
This is why Big Data would be of big help to water conservation and refinement, and thus, a big step towards a sustainable world.
We can’t live without sufficient clean water
Early September 2020, households (and maybe businesses) in the Malaysian state of Selangor suffered a water cut, when four water treatment plants were closed due to a leakage of pollutants from a factory.
Upon hearing the announcement of a water cut, residents scrambled to load their buckets with water to cope with the disruption for a few days.
However, the buckets wouldn’t be enough for bathing, drinking, cooking and cleaning in this hot tropical country, so running out of water was inevitable.
To add the rotten cherry on top of the moldy cake, holding back frustration at the unsatisfactory management of water supply was so hard, especially for residents who always pay the water bills.
But disrupting the water supply to allow the water supply board to deal with the contamination probably saved many from the dangers of water contamination.
In Germany last year, fresh water reserves reached a very low level due to insufficient rainfall, an unusually hot summer and a dry winter.
This hot spell left many Germans so thirsty and deprived of their watery needs that what they got, instead of water, was a harsh reality check about water’s scarcity. Scenarios such as these often remind us of how precious water is, and thus, raise the issue of water conservation and refinement.
As a reminder, water conservation is the efficient usage of water to minimise water wastage, while water refinement is the removal of unwanted elements and the addition of beneficial elements for the water to be usable.
In Part 1 of our Big Data-driven sustainable development goals article series, we learnt that Big Data can drive better decisions for water conservation and refinement. Here, we take a closer look.
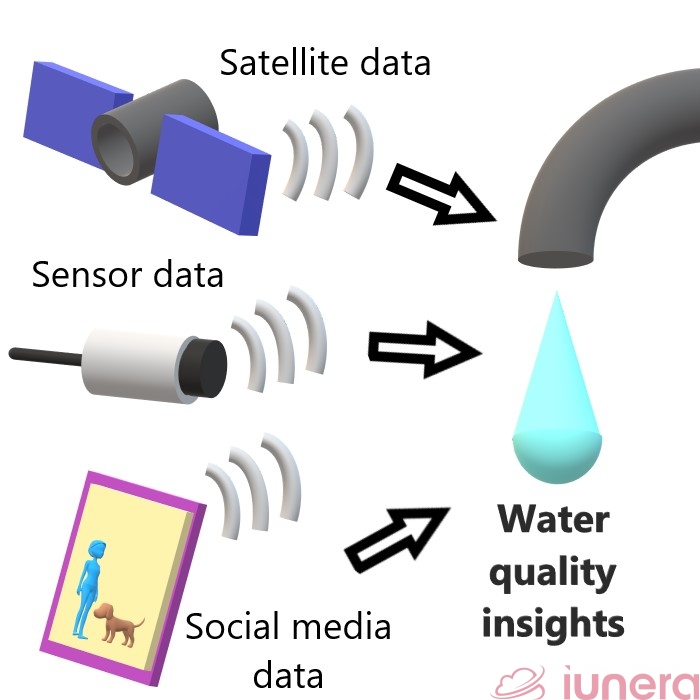
Data sources for sustainable water management
According to a compiled study authored by Sun and Scanlon, these are usually where Big Data for water management come from:
- high-frequency data products derived from Earth observation systems.
- multi-sensor data collected from ground-based monitoring networks and IoT.
- large-scale datasets collected from field experiments via multiple instruments.
- data simulated by large-scale Earth system models.
- crowdsourced data from social media and citizen science.
Internet of Things (IoT) to collect sensor data about water supply
A study by Piratla, Matthews and Koo has a great example of Big Data’s application in water management as it dives deep into the use of Internet of Things (IoT) tech in the water supply system.
In case you didn’t know, IoT refers to objects that are connected to the internet and “talk” to each other, according to WIRED.
“Simply, the IoT is made up of devices – from simple sensors to smartphones and wearables – connected together.”
said Matthew Evans, the IoT programme head at techUK, quoted by WIRED.
Combining IoT devices with automated systems enable the gathering, analysis and decision making in a particular task or process. In the case of water management, the IoT systems are:
- Hardware system: made up of sensors, sensor actuators, and embedded communications board;
- Midware system: made up of data storage such as data cloud in network system or embedded data storage in IoT device;
- Visualisation system: made up of user interface display, user interaction, data interpretation, and event determination.
Downstream and upstream data are collected using Wireless Sensor Network (WSN) tech connected to IoT.
The downstream data collected provide insights on water usage and performance while upstream data are similar to traditional Supervisory Control And Data Acquisition (SCADA) and Automated Meter Reading (AMR) systems.
WSN for monitoring water quality
Matin and Islam define WSNs as:
“self-configured and infrastructure-less wireless networks to monitor physical or environmental conditions, such as temperature, sound, vibration, pressure, motion or pollutants,
and to cooperatively pass their data through the network to a main location or sink where the data can be observed and analysed.”
Matin and Islam in 2012.
According to Pule, Yahya and Chuma, WSN can be used to monitor water quality in real-time, a task which involves detecting its characteristic parameters and comparing them with set standards and guidelines.
The common water quality characteristic parameters are:
- pH: pH is the degree of acidity or alkalinity of a solution. pH 7 is neutral, below that is acidic while above is alkaline. The target pH for water supply is between 6 and 9 – about neutral.
- Electrical conductivity: This is the solution’s capability to pass electrical current. It indicates the concentration of conducive ions normally derived from dissolved salts and inorganic material. More ions indicate higher conductivity. The target conductivity for water is between 0 and 2,500 μS/cm (microSiemens per centimetre).
- Oxidation reduction potential (ORP): This measures the strength of transferring electrons between component species in a solution, reflecting the water’s ability to remove contaminants. The target ORP for water should be very high.
- Turbidity: This is the concentration of suspended and colloidal particles in water, measured in nephelometric turbidity units (NTU). In other words, it’s the cloudiness of water. And we all know we don’t want cloudy or murky water, so the target turbidity for water is less than 1 NTU.
If the water supply is neutral, less conductive, has high ORP and zero turbidity, we’re safe. In contrast, if the WSN detects any deviation from these standards, it means that the water is polluted and needs to be attended to ASAP!
SCADA for monitoring water treatment plants
SCADA is a computer system that gathers and analyses real-time data to monitor a facility in industries spanning across water management, waste control, energy generation and so on.
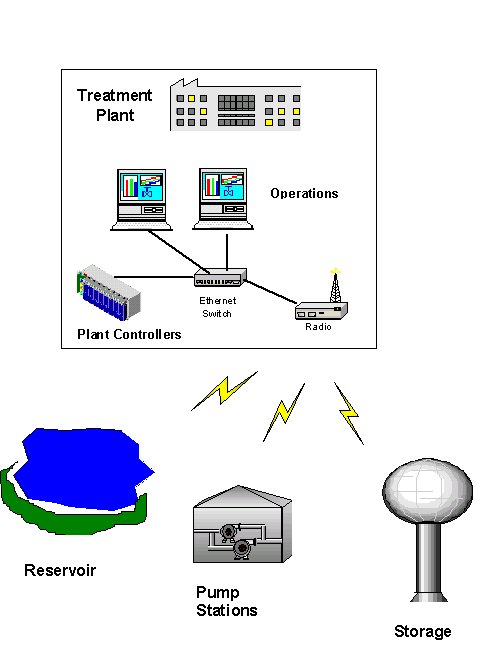
Image Source: International Society of Automation
In the International Society of Automation’s explanation, SCADA typically consists of workstations, programmable logic controllers (PLCs), a local area network (LAN) and remote terminal units (RTUs):
- Workstations are located in a control room of PCs at the treatment plant and allow operators to view the entire treatment process and perform control actions.
- PLCs within the plant supervise unit processes like chemical treatment and filtration of water.
- A LAN like Ethernet links the PLCs and workstations to each other.
- RTUs usually exist in vulnerable areas like pump stations, storage tanks, valve vaults and treatment facilities at remote sites. They communicate on a wide area network through wireless means.
With such an integrated sensing and communication system in place, SCADA can:
- Coordinate security measures with process operations by detecting security breaches at treatment plants.
- Minimise manned patrols while providing constant system-wide monitoring.
- Record alarms and events, and automatically react to them by performing emergency shutdowns or other control actions.
- Typically expand rather easily via additional I/O points, RTU devices and network links.
AMR for more accurate water meter readings
The AMR automatically collects consumption, diagnostic and status data from water or energy metering devices via data sensing, and transfers those data to the central database for billing, troubleshooting and analyses.
An alternative to the troublesome manual meter reading, benefits of AMR include but are not limited to:
- eliminating manual reading field operators
- increasing the effectiveness and accuracy of meter reading and billing
- reducing overall service costs
- standardising meter inventory
It seems that a more accurate meter reading can inform utilities about potential water leaks to determine water distribution pipelines that need replacement.
Data fusion for Big Data analysis of the water supply system
All these data are then converged to build a Big Data system through a process called data fusion.
“Data fusion is the process of getting data from multiple sources in order to build more sophisticated models and understand more about a project. It often means getting combined data on a single subject and combining it for central analysis.”
Techopedia’s definition of data fusion
In this case of water management, all the WSN, SCADA and AMR data about water quality, treatment plant conditions and meter readings are combined in one BIG FAT – I mean, Big Data system, where data miners can extract issues such as:
- whether the water is safe to use
- which areas of a region is the water not safe to use
- which areas of a region has water leakage or disruption
- which areas of a region lack access to sanitised water supply
- for how many households are the water reserves enough to serve
- the implications of water supply problems on communities
IoT-based precision irrigation in agriculture
Smart water management isn’t limited to sustainable and safe consumption by households and business premises, but extends to sustainably watering crops, which will then be sold to consumers for consumption.
More than 70% of the fresh, usable water is used for irrigation for agriculture. However, a lot of water is wasted in irrigation due to over-irrigation, which refers to spraying more water than needed.
Farmers tend to resort to over-irrigation to avoid under-irrigation, which is obviously the opposite of over-irrigation a.k.a. spraying less water than needed.
Precision irrigation uses water efficiently, while avoiding both under- and over-irrigation, by spraying the exact amount of water needed to increase crop yield, cut costs and save water.
To enable precision irrigation, a paper by Kamienski et al presented the architecture of the SWAMP Platform, an IoT-based smart water management platform for precision irrigation.
According to them, the SWAMP Architecture has five layers (you may refer to the detailed infographic for this here):
- Layer 1 – Device and Communication: Various sensor, actuator and low-power wide-area network (LPWAN) communication tech to gather and communicate data related to soil, plants and weather; Drones used for snapping images.
- Layer 2 – Data Acquisition, Security and Management: Protocols, software components and an open source platform for data acquisition, security and device management purposes.
- Layer 3 – Data Management: Software components for data storage, processing and distribution; Data mappers including one from external data sources like historical agriculture yield databases and weather forecasters; A distributed infrastructure made up of cloud servers and fog nodes to deal with Big Data and make the data available to the upper layers.
- Layer 4 – Water Irrigation and Distribution Models: Traditional agriculture models for predicting plant water needs using drone images and soil moisture levels detected by soil sensors; Machine learning can either paired with the traditional model or used as its substitute.
- Layer 5 – Water Application Services: Irrigation services that make sense to farmers and water distributors via user interfaces.
By using a whole system of IoT-based technologies and machine learning algorithms, it’s possible to use the precise amount of water for irrigation.
Embracing the wave of data
An abundance of water data provides opportunities to water utilities and farmers to analyse these data and generate useful insights to make better decisions. IoT plays a big part in gathering the data they need.
WSN is used to monitor water quality by measuring the water’s pH level, electrical conductivity, ORP and turbidity. By checking if the water’s pH is neutral, conductivity is low, ORP is high and turbidity is zero, utilities can ensure that the water is safe for public consumption.
SCADA, which is spread throughout the water supply system for sensing and communication, can inform operators and managers if the water treatment facility is secure and in top condition without needlessly putting patrollers on shift.
AMR can also remove the trouble of manual meter reading and billing by automatically gathering and transferring data to the database.
A possible combination of these technologies allow farmers to know precisely how much water they need to add to the crops for crop yield, cost and water usage optimisation.
This shows that employing Big Data and IoT tech for real-time water monitoring enables timely responses to water contamination and/or leakage/wastage.
And by bringing together these tech, the data can be used to find the answers utilities and farmers seek and not just check on the surface.