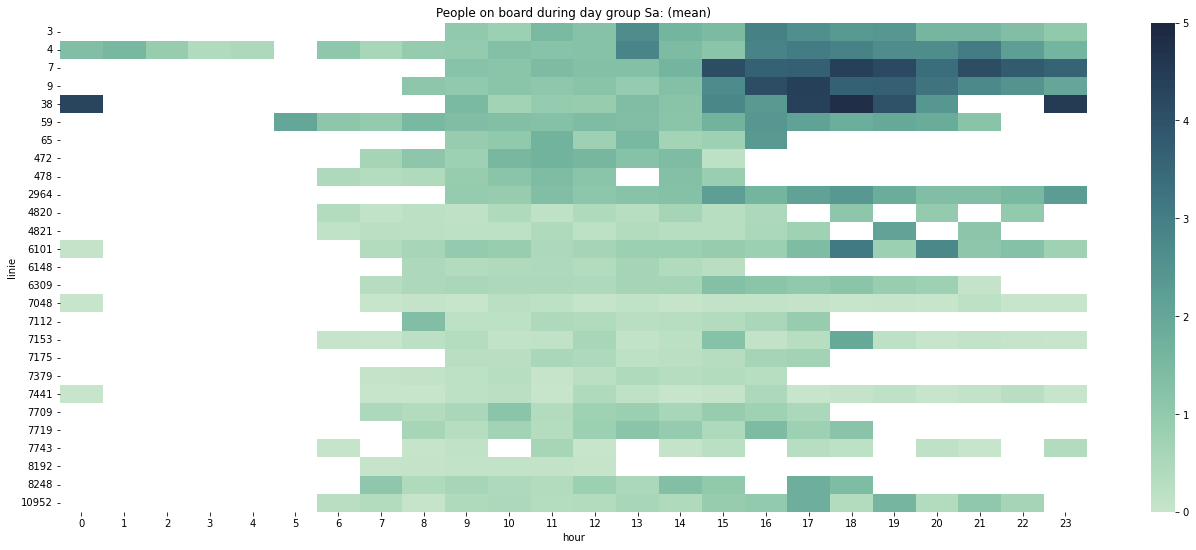
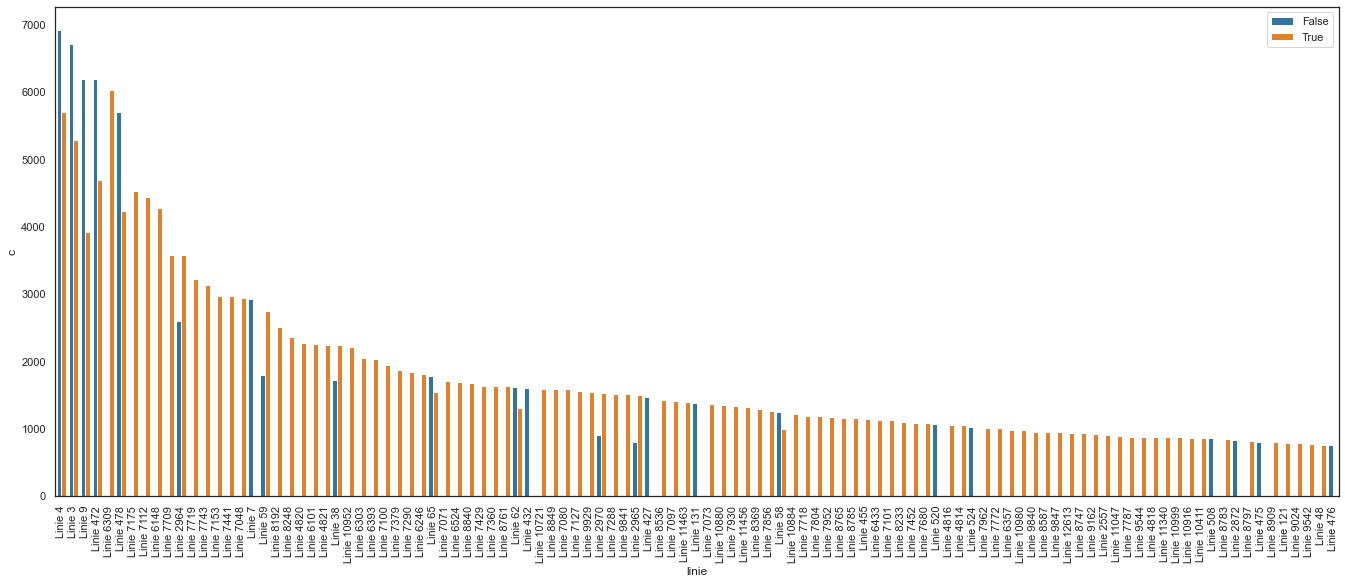
The public transport data sparsity from our previous article led to our attempt in finding more answers using heatmaps to zoom in to the limited data we have.
Here's how we familiarised ourselves with the public transport people counting data set we received.
This article looks at why it makes sense to use sensor data analytics in public transport.
Kenya's transport landscape doesn't bear much resemblance to the conventional ones. Could this influence the data analysis of Kenya's transport system?
Despite the perceived risk of Covid-19 infections in public transport, more passengers might be using public transport nowadays.
This article lists the many possible people counting options that public transport operators have for counting the number of passengers in public transport.


