
German Christmas markets are threatened by the upcoming Covid-19 winter! There are concerns that the Northern hemispheric winter will cause a second wave of Covid-19 infections, dubbed as coronavirus winter (or Covid-19 winter). Even though equatorial countries are not experiencing winter, Covid-19 winter is still a major concern especially since borders have reopened or there are plans to reopen. With that said, we are again using the control score approach to rank the countries according to their control of the coronavirus as we did before and determine the likelihood of these countries getting a Covid-19 winter (or celebrating a coronavirus free Christmas).
Disclaimer: We assume that the numbers recorded and presented by the ranked countries at the time of data analysis are correct.

Image Source: Alesia Kazantceva
- Coronavirus winter is coming, so it will be cold outside
- The control score approach to predict which country is getting a Covid-19 winter
- The Covid-19 winter ranking
- Some subcontinental comparisons
- An issue in this ranking attempt
- How have the scores changed for the top 100 countries since the last time?
- The author’s opinion about travelling with a second wave on the way
- How can we survive this Covid-19 winter?
- Important questions
Coronavirus winter is coming, so it will be cold outside
“The epidemiological behavior of this virus will not be that much different from other respiratory diseases. During winter, they come back. There will be another wave, and it will be very serious. More than 90% of the population is susceptible.”
Former World Health Organisation (WHO) virologist, Klaus Stohr said in an interview with Bloomberg.
Klaus Stohr is trying to warn everyone about a coronavirus winter that we all get a Coronavirus free Christmas. And there seems to be enough reason to not give his words the cold shoulder.
Look at how the Southern hemispheric winter affected the countries there. Australia’s second-most populous city, Melbourne, reportedly experienced a virus resurgence during its Coronavirus winter season mid-2020, resulting in a second lockdown.
Not only are people going to be cooped up together indoors to feel warm and hence susceptible to infections, research by the University of Sydney found that the coronavirus thrives in less humid conditions as it hangs around longer in drier air, which is typical of winter.
Furthermore, a large infections of a butchery employees in Germany and associated research indicate that closed doors and cold air can create challenging conditions in the Coronavirus winter and ultimately threaten a Coronavirus free Christmas.
Now, we might be anticipating a potential repetition of this situation in the Northern hemisphere as it enters the autumn season. Europe is already recording a sharp rise in the number of new Covid-19 infections in recent weeks.
In light of such breaking news, we decided to estimate the likelihood of the countries experiencing a coronavirus winter using the same control score approach we used previously to rate each country’s control over Covid-19 (and thus, the likelihood of getting a second wave of the Coronavirus).
The control score approach to predict which country is getting a Covid-19 winter
In prior articles, we introduced Data Science computations to score countries in their coronavirus recovery.
These Data Science computations can also be used to analyze the likelihood and the changes of countries towards the Covid-19 winter and a Coronavirus free Christmas.
Therefore, we repeat our previous explanation about the control score formula for your reference before jumping into the analysis. Here’s the formula to compute a control score rating for each country:
Control Score = activepercent × normalisedStability ÷ activeToPopulation1000
As we can see from the formula of the control score, the variables are activepercent, normalisedStability and activeToPopulation1000.
Active percent
active cases = Total Infected – Cured – Deaths
activepercent = current active cases ÷ maximum number of active cases
- The activepercent shows the number of current active cases compared to the highest number of active cases ever.
- Active cases exclude those who have recovered and the victims who have passed away.
Normalised stability
normalisedStability = log [(activepercent 28 days ago) – (current activepercent)]
- Normalised stability shows how stable the changes in the number of cases are. A higher normalised stability figure (which is absolute) shows that the changes are more stable.
- A trend of 28 days was used because measuring over 14 days does not show enough change in some countries. However, there are other countries in the data set where the changes are huge.
- Normalisation of data is used when there are extremely large changes in values over time in certain countries, and hence, the changes need to be reorganised in a way that they can all be analysed more easily.
- Based on the data available, using logarithms is a suitable method for normalising data.
Active to Population1000
activeToPopulation1000 = current active cases ÷ 1000 of the population
- The active to population1000 figure reflects the infection risk. That is, the risk of each person in every 1000 people in a country getting infected.
- 1000 is used to standardise the population size. Comparing the number of active cases to a million or billion people will result in a very small number.
Control Score
Control Score = activepercent × normalisedStability ÷ activeToPopulation1000
- The control score shows the control of cases with respect to infection risk (again, infection risk is the active cases per population).
- The control score has a positive relationship with activepercent and normalised stability, and a negative relationship with infection risk. That’s why activepercent and normalised stability are multiplied and then divided by the infection risk.
The Covid-19 winter ranking
We measured the data in the following table in early October 2020.
The ranking gives us clues about a country’s performance in controlling Covid-19 and likelihood of suffering a Covid-19 winter. The highest control score (starting from 1st place) indicates that the country has the highest control over Covid-19 and is least likely to be affected by a Covid-19 winter.
On the other end, the lowest control score (last place) indicates that the country has the lowest control over Covid-19 and is most likely to suffer a Covid-19 winter.
| Country/Region | roundedControlScore | activecases |
|---|---|---|
| Lao People’s Democratic Republic | 31899 | 1 |
| Cambodia | 24895 | 3 |
| China | 18577 | 354 |
| Viet Nam | 9151 | 41 |
| Niger | 6773 | 16 |
| Papua New Guinea | 4052 | 6 |
| Taiwan, Province of China | 3855 | 26 |
| Mongolia | 2389 | 6 |
| Western Sahara | 2288 | 1 |
| Thailand | 2087 | 138 |
| Brunei Darussalam | 1990 | 1 |
| Fiji | 1748 | 2 |
| Egypt | 1305 | 331 |
| Chad | 1199 | 54 |
| Yemen | 777 | 132 |
| Burundi | 775 | 40 |
| Sri Lanka | 655 | 128 |
| New Zealand | 512 | 41 |
| Liberia | 485 | 44 |
| Côte d’Ivoire | 365 | 308 |
| Mauritius | 305 | 18 |
| Eritrea | 305 | 40 |
| Ghana | 271 | 494 |
| Comoros | 237 | 14 |
| Barbados | 158 | 7 |
| Seychelles | 144 | 3 |
| Cameroon | 136 | 740 |
| Singapore | 126 | 211 |
| Madagascar | 120 | 817 |
| Zambia | 115 | 547 |
| Somalia | 111 | 493 |
| Mauritania | 110 | 181 |
| Pakistan | 103 | 9135 |
| Benin | 102 | 343 |
| Korea, Republic of | 88 | 1825 |
| Nigeria | 83 | 7456 |
| Sao Tome and Principe | 82 | 12 |
| Equatorial Guinea | 73 | 83 |
| Australia | 69 | 1377 |
| Guinea | 63 | 603 |
| Japan | 48 | 7051 |
| Antigua and Barbuda | 45 | 8 |
| Malawi | 41 | 1065 |
| Uzbekistan | 37 | 2907 |
| Cuba | 34 | 540 |
| Zimbabwe | 30 | 1330 |
| Mali | 29 | 563 |
| Afghanistan | 26 | 4993 |
| Liechtenstein | 25 | 6 |
| Kazakhstan | 24 | 3247 |
| Bhutan | 24 | 53 |
| Azerbaijan | 23 | 1612 |
| Malaysia | 23 | 1735 |
| Dominica | 23 | 7 |
| Haiti | 21 | 1633 |
| Suriname | 19 | 95 |
| Senegal | 19 | 2005 |
| Tajikistan | 16 | 1111 |
| San Marino | 15 | 10 |
| Uruguay | 15 | 243 |
| Congo | 13 | 1379 |
| Saudi Arabia | 13 | 10173 |
| Gabon | 11 | 676 |
| Eswatini | 11 | 343 |
| Belarus | 9 | 3853 |
| Rwanda | 8 | 1612 |
| Kyrgyzstan | 8 | 2840 |
| South Sudan | 8 | 1375 |
| Turkey | 8 | 30762 |
| Germany | 7 | 29580 |
| Guatemala | 7 | 8423 |
| Croatia | 5 | 1447 |
| Norway | 5 | 2897 |
| Guinea-Bissau | 5 | 774 |
| Chile | 5 | 14671 |
| Cyprus | 5 | 420 |
| Qatar | 4 | 2821 |
| Sierra Leone | 4 | 483 |
| Venezuela (Bolivarian Republic of) | 4 | 8899 |
| South Africa | 4 | 50015 |
| El Salvador | 4 | 4326 |
| Finland | 4 | 1946 |
| Gambia | 3 | 1249 |
| Monaco | 3 | 32 |
| Mexico | 3 | 41080 |
| Switzerland | 3 | 6508 |
| Estonia | 3 | 783 |
| Ecuador | 3 | 16458 |
| Namibia | 3 | 2030 |
| Bangladesh | 3 | 82171 |
| Angola | 2 | 2741 |
| Philippines | 2 | 58606 |
| Italy | 2 | 55566 |
| Romania | 2 | 22060 |
| Colombia | 2 | 63790 |
| Mozambique | 2 | 3249 |
| United Arab Emirates | 2 | 10212 |
| Malta | 2 | 455 |
| Oman | 1 | 9122 |
| Luxembourg | 1 | 1156 |
| Kuwait | 1 | 7403 |
| North Macedonia | 1 | 2585 |
| Kenya | 1 | 13030 |
| Maldives | 1 | 1121 |
| Armenia | 1 | 6370 |
| Trinidad and Tobago | 1 | 1834 |
| Iceland | 1 | 650 |
| Dominican Republic | 1 | 22163 |
| Bolivia (Plurinational State of) | 1 | 31391 |
| Brazil | 1 | 399738 |
| Cabo Verde | 1 | 825 |
| Peru | 1 | 93310 |
| Belize | 1 | 762 |
| Central African Republic | 1 | 2869 |
| Russian Federation | 1 | 205261 |
| Libya | 0 | 14620 |
| India | 0 | 944996 |
| Lesotho | 0 | 715 |
| Bahrain | 0 | 5239 |
| Bosnia and Herzegovina | 0 | 5996 |
| Austria | 0 | 8578 |
| Ireland | 0 | 12494 |
| Costa Rica | 0 | 33225 |
| Panama | 0 | 21044 |
| Jamaica | 0 | 4331 |
| Nepal | 0 | 21302 |
| Andorra | 0 | 517 |
| Albania | 0 | 5189 |
| Denmark | 0 | 6392 |
| Guyana | 0 | 1107 |
| Honduras | 0 | 47202 |
| Czechia | 0 | 40821 |
| Israel | 0 | 71510 |
The table indicates that Laos is least likely to suffer the Northern hemispheric winter wave with a score of 31,899, followed by a few other Asian countries, some African countries and Papua New Guinea in the top ten.
A European country with the highest score has been traced to 49th place occupied by Liechtenstein, with a score of 25. Meanwhile, a North American country with the highest score is Mexico with a score of 3 at 85th place.
The graph below shows the active percent of countries with the highest control score in Asia, Africa, Europe and North America between 22nd January 2020 and 23rd September 2020.
These countries seem to have experienced some major fluctuations in their active percent over the past three quarters. Cambodia and Liechtenstein’s active percents peaked around the same time in late March and dropped together in April to May.
Although Liechtenstein’s active percent continued to lay low since then, Cambodia’s active percent peaked again in late July and then gradually reduced. Niger experienced a similar trend as Liechtenstein when Niger’s active percent peaked in late April, then dropped and remained low.
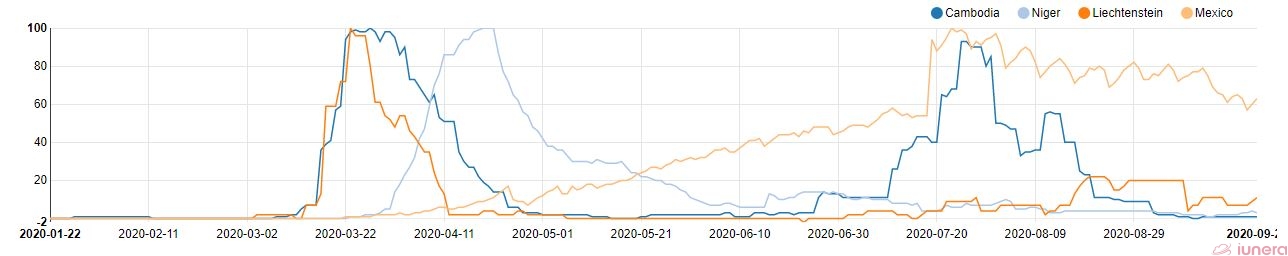
On the contrary, Mexico’s initially low active percent experienced a gradual increase and peaked in late July. Instead of dropping down to the ground, Mexico’s active percent continued to stay high.
On the other end of the ranking table are Panama, Nepal, Libya, Lesotho, Jamaica, Israel, Ireland, India, Honduras and Guyana in the bottom ten, all with scores of zero.
An Asian country with the lowest score is Nepal at 132nd place, with a score of zero, while an African country with the lowest score is Libya at 131st place, also with a score of zero.
Similar to the previous graph, this graph below shows the active percent of countries with the lowest control score in Asia, Africa and Europe between 22nd January 2020 and 23rd September 2020.
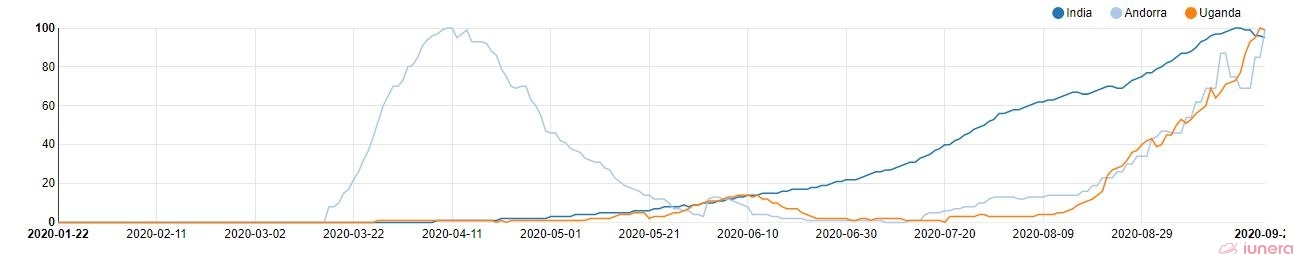
Unlike the previous graph, this graph seems to indicate a much different trend of active percents, especially for India and Uganda.
While Andorra’s active percent peaked in mid-April and slowly dropped, India and Uganda’s active percents were initially low. Towards the middle of this year, the active percents of the three countries began to climb to their peaks, reaching their all-time highs very recently.
(Note: the rankings in late September and early October indicate the slight changes in scores and positions of the ranked countries)
Some subcontinental comparisons
Because we’re a German company, we’re curious to find out how Germany performed compared to the rest of Europe and Western Europe. And since a few Southeast Asian countries – especially Vietnam – keep popping up, we also want to compare the active percents of some of the Southeast Asian countries.
We’ll just show a few graphs (between 22nd January 2020 and 23rd September 2020).
Germany vs Europe
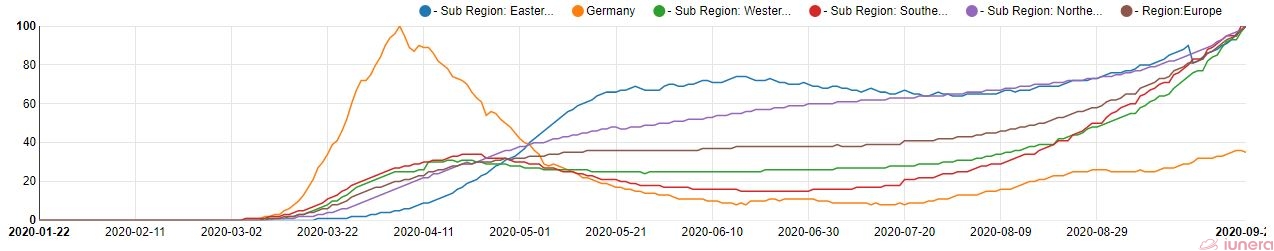
Germany’s active percent was initially higher than the active percents of the rest of Europe combined. As months went by, Germany’s active percent began to go low while the active percents of the European subcontinents hiked up until their recent peak.
Ultimately, we see that Germany seems to be more in control of the Coronavirus than other european countries. That beeing said, it is to soon to believe that Germany is immune to the coming Coronavirus winter and ultimately, Covid-19 threatens to demand a death toll for Christmas 2020.
The 13th of March 2020 was when WHO declared Europe as the “epicenter” of the coronavirus pandemic with more reported cases and deaths “than the rest of the world combined”. A few days later, most of Europe went into lockdown.
Their early response may have helped keep the cases at bay but only temporarily as the European cases climbed to their maximum over the months.
Germany though reached its peak early on and never went to its peak again (so far). Turns out that Germany isn’t the only one with this trend as you’ll see in the next graph.
Germany vs Western Europe
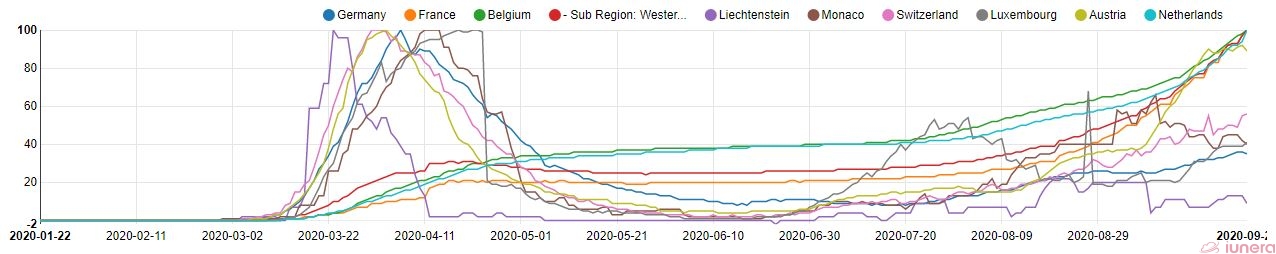
In this detailed graph, we can see that – along with Germany – Liechtenstein, Austria, Switzerland, Luxembourg and Monaco experienced peaks in active cases between March and May. Meanwhile, Belgium, France and the Netherlands didn’t reach their peaks until recently.
However, Germany’s active percent is currently higher than that of Liechtenstein, and lower than that of other Western European countries.
Just like the whole of Europe, the active percent of Western Europe generally seems to be on an upward trend this autumn, meaning that the subcontinent’s overall active cases are reaching their maximum (again).
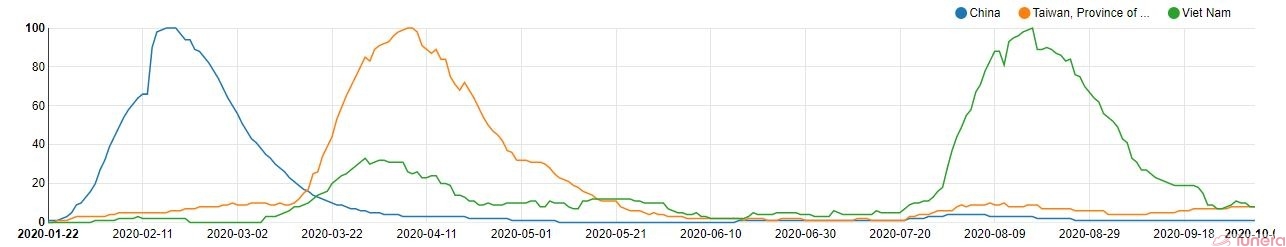
Vietnam vs Asia
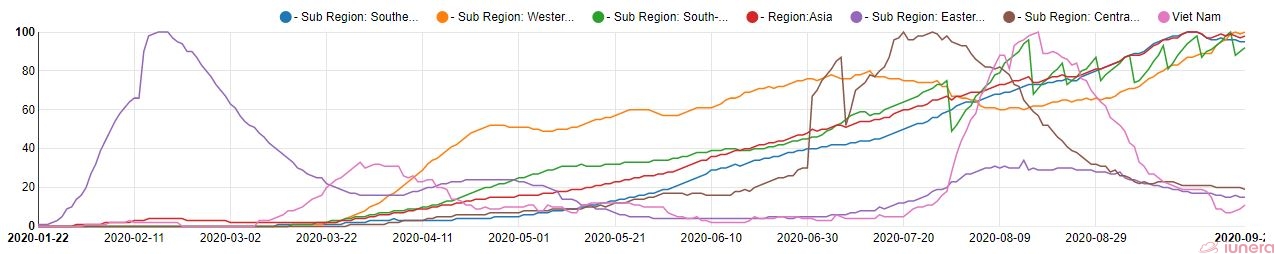
Vietnam‘s active percent seems to be blending in with those of the rest of the Asian subcontinents, laying low and then peaking after July. But the Eastern Asian subcontinent’s active percent trend sticks out like a sore thumb.
It’s commonly known that China, which is in Eastern Asia, was where the Covid-19 was first detected and thus, acted a lot more quickly than the rest of Asia and the world.
That could explain why Eastern Asia’s peak is shown to be the earliest. After that, its active percent has remained low.
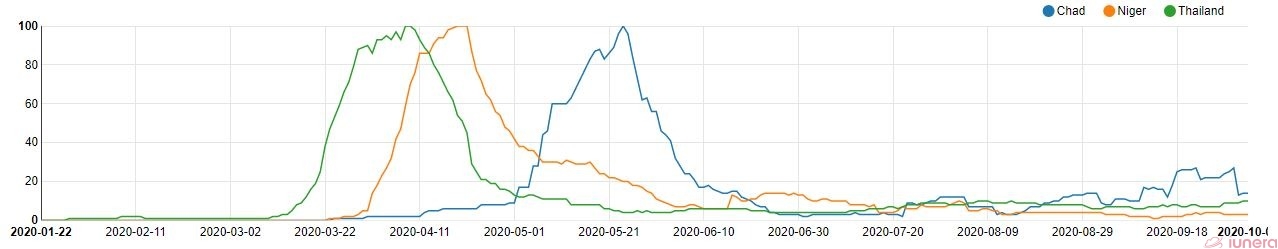
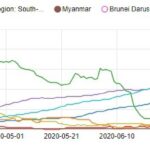
Vietnam vs Southeast Asia
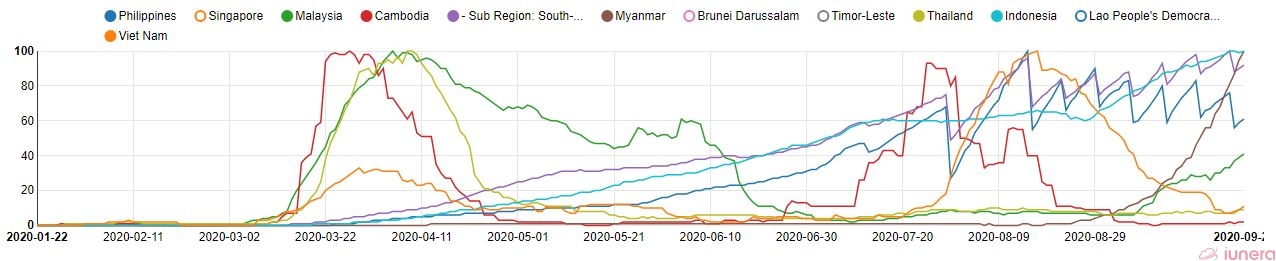
Judging by how this graph is, the active percents of the Southeast Asian countries are mixed. The active percents of some Southeast Asian countries like Cambodia, Vietnam and Thailand are now low.
Taking a closer look, Cambodia and Thailand peaked in March and April respectively while Vietnam peaked in August.
But the three of them recently ended up having much lower active percents than the other countries in the subcontinent like Malaysia, Indonesia, Myanmar and the Philippines.
Malaysia peaked around the same time as Cambodia and Thailand, but unlike the latter two, Malaysia’s active percent is increasing.
Indonesia, Myanmar and the Philippines’ active percents are experiencing a generally upward trend and reaching their peaks. These countries with such upward trends could be causing the overall active percent of Southeast Asia to be high now.
Malaysia vs Singapore
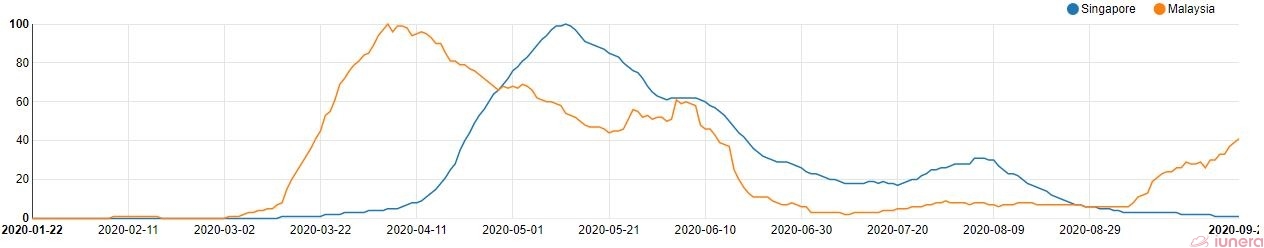
Just for the fun of it, we also checked the active percents of fellow neighbours, Malaysia and Singapore who are likely to open their borders first with each other in Southeast Asia.
Malaysia and Singapore are both tropical and far away from Europe, it will be very interesting to watch their dynamic over the Covid-19 winter and their hopefully Coronavirus free Christmas.
Singapore’s active percent peak came nearly two months after Malaysia’s peak. Then, Singapore caught up with its neighbour and they rolled down the hill together… Until things started heating up in Malaysia in early September, especially in its Bornean state of Sabah.
South Africa vs Africa
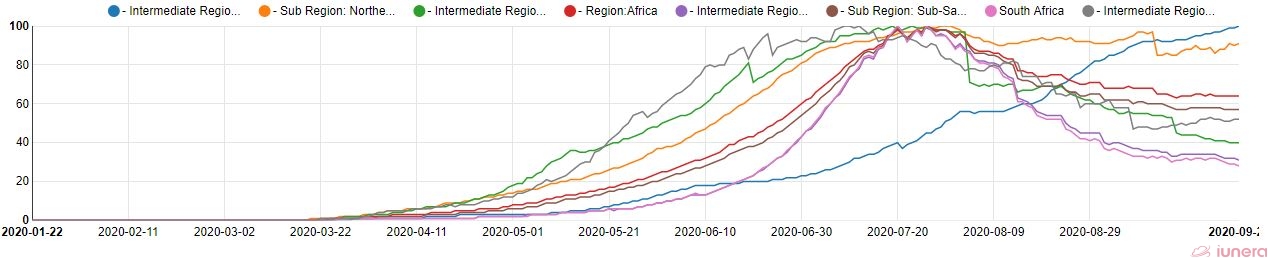
South Africa also seems to be blending in with the rest of Africa, where the trend is to smoothly increase to the peak in late July and then smoothly decrease.
The exceptions to this trend are two African subcontinents, Northern Africa and Eastern Africa. Northern Africa peaked in July as well, but instead of decreasing with the others, its active percent stayed up there.
Meanwhile, Eastern Africa was late to the party, so it’s just reaching its peak now.
South Africa vs Southern Africa
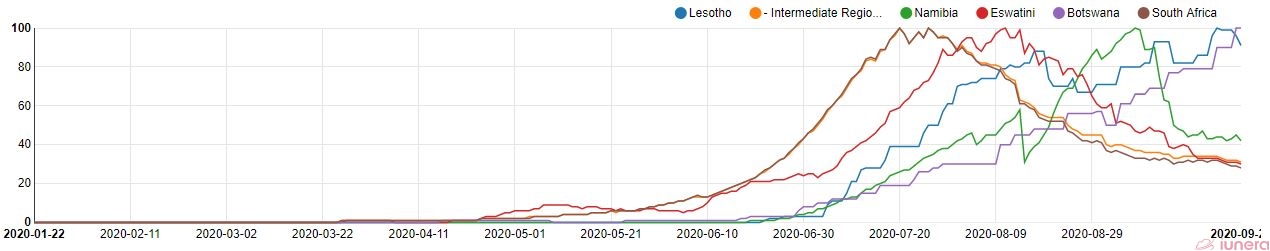
Note that there’s a difference between South Africa the country and Southern Africa the subcontinent.
This graph seems to indicate that Lesotho and Botswana’s active percents are reaching their peaks while the active percents of the rest of Southern Africa are going down (since they reached their peaks earlier).
New Zealand vs Fiji vs Oceania
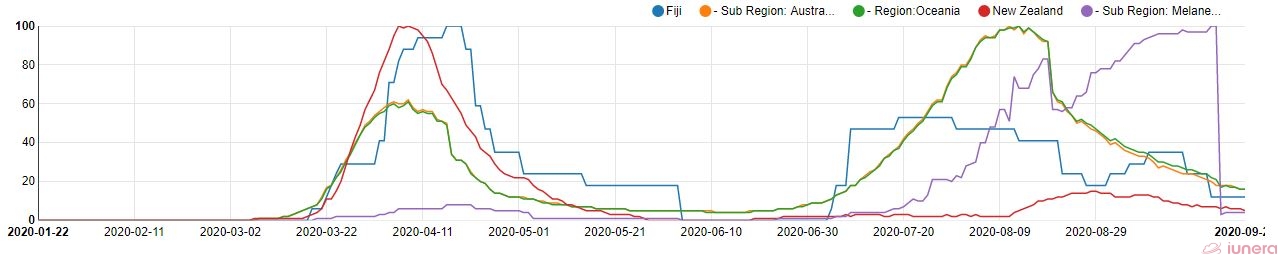
Australia, New Zealand and Fiji peaked some time in April and went their separate ways shortly after. Australia peaked again in August, Fiji was sort of fluctuating and New Zealand was just low. But eventually, they are close to reuniting with low active percents.
Fiji vs Melanesia
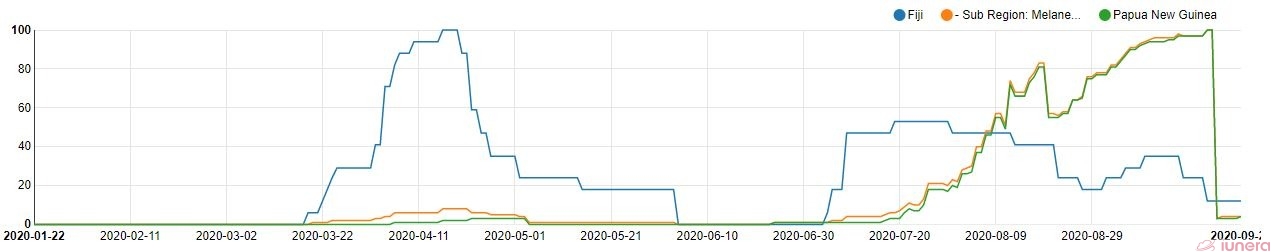
Melanesia, which includes Papua New Guinea in this analysis, started off low until mid-September when it peaked. Immediately after, Melanesia experienced a drastic drop, like its active percent jumped off a cliff.
Brazil vs the USA vs the Americas
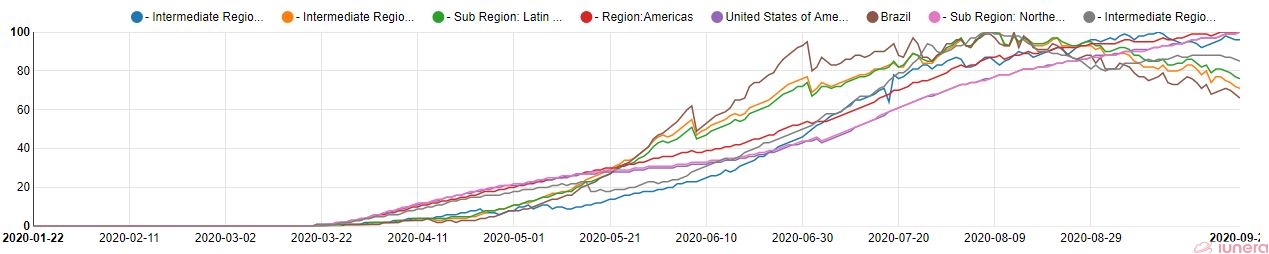
The Americas are generally experiencing an upward trend, especially in North America, where the unrated giants USA and Canada have yet to reach their peaks.
And also, Trump just tested positive.
Brazil vs South America
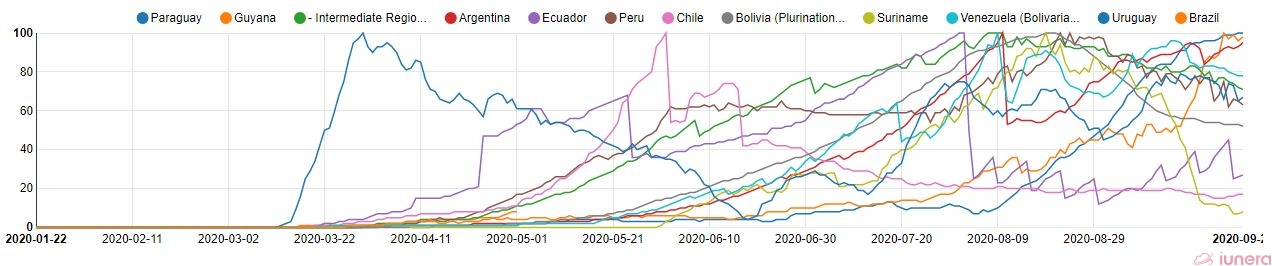
I thought that Southeast Asia’s graph looks messy until I saw South America’s graph. So messy that it’s very difficult to point out what’s been going on in South America. Their trends can only be read individually to get a clear picture.
But the important thing to know is that now is not a good time for people in Brazil, Argentina, Uruguay, Paraguay, Venezuela and Peru.
An issue in this ranking attempt
Now, you may be wondering why the USA did not appear in the ranking table above. Perhaps, the table of unrated countries below could provide an explanation about the elephant in the room.
| Country/Region | roundedControlScore | activecases | activepercent28Daystrend |
|---|---|---|---|
| Grenada | null | 0 | 0 |
| Holy See | null | 0 | 0 |
| Tanzania, United Republic of | 0 | 305 | 0 |
| Djibouti | 456 | 10 | 0 |
| Sudan | 0 | 6053 | -3 |
| Saint Lucia | null | 0 | 0 |
| Serbia | 0 | 33089 | -6 |
| Nicaragua | 0 | 2106 | -23 |
| Sweden | 0 | 88388 | -10 |
| Saint Kitts and Nevis | 104 | 2 | -13 |
| Algeria | 0 | 13757 | -12 |
| United States of America | 0 | 4275490 | -12 |
| Iran (Islamic Republic of) | 0 | 53698 | -43 |
| Togo | 0 | 417 | -16 |
| Canada | null | null | null |
| Bulgaria | 0 | 5693 | -25 |
| World | 0 | 9719016 | -16 |
| Portugal | 0 | 26407 | -42 |
| Ethiopia | 0 | 44321 | -19 |
| United Kingdom of Great Britain and Northern Ireland | 0 | 437851 | -31 |
| Poland | 0 | 23327 | -32 |
| Syrian Arab Republic | 0 | 2982 | -24 |
| Moldova, Republic of | 0 | 14060 | -25 |
| Latvia | 0 | 674 | -70 |
| Belgium | 0 | 97934 | -39 |
| Iraq | 0 | 62919 | -14 |
| Burkina Faso | 0 | 698 | -63 |
| Indonesia | 0 | 63399 | -27 |
| Spain | 0 | 607470 | -47 |
| Botswana | 0 | 2446 | -39 |
| Ukraine | 0 | 121363 | -42 |
| Lithuania | 0 | 2493 | -60 |
| Argentina | 0 | 143909 | -16 |
| Greece | 0 | 17861 | -45 |
| Bahamas | 0 | 1861 | -21 |
| Netherlands | 0 | 126393 | -45 |
| France | 0 | 497057 | -54 |
| Morocco | 0 | 20248 | -26 |
| Paraguay | 0 | 16027 | -34 |
| Slovenia | 0 | 2134 | -76 |
| Lebanon | 0 | 23837 | -41 |
| Montenegro | 0 | 3957 | -72 |
| Uganda | 0 | 4037 | -52 |
| Slovakia | 0 | 7474 | -77 |
| Hungary | 0 | 22081 | -85 |
| Tunisia | 0 | 15636 | -81 |
| Georgia | 0 | 3524 | -91 |
| Jordan | 0 | 9560 | -93 |
| Myanmar | 0 | 11337 | -92 |
The unrated countries in this table are excluded from the main table because a control score cannot be computed for them, for the following reasons:
- There might be insufficient reporting of cured cases that are required for us to compute the numbers of active cases in these countries.
- The absolute numbers of active cases per day are still growing for these countries, more than before, which means that there is no turning point yet. The control score cannot be computed as long as the numbers of cases keep growing.
- The numbers in the last 28 days are fluctuating a lot, indicating that the situation is not stable at the moment.
These reasons serve as the main barriers to computing the control scores for these countries.
How have the scores changed for the top 100 countries since the last time?
We also wanted to talk about how the scores changed for the top 100 countries since the last time we calculated them as well as which countries held on to being in the top 20.
Here’s a table showing the countries in the top 100 now and in June.
| number | Country/Region now | Country/Region in June |
|---|---|---|
| 1 | Lao People’s Democratic Republic | Vietnam |
| 2 | Cambodia | Taiwan |
| 3 | China | China |
| 4 | Viet Nam | Chad |
| 5 | Niger | Thailand |
| 6 | Papua New Guinea | Mauritius |
| 7 | Taiwan, Province of China | Niger |
| 8 | Mongolia | Cambodia |
| 9 | Western Sahara | Uganda |
| 10 | Thailand | Malaysia |
| 11 | Brunei Darussalam | Myanmar |
| 12 | Fiji | Cuba |
| 13 | Egypt | Burkina Faso |
| 14 | Chad | Tunisia |
| 15 | Yemen | Mongolia |
| 16 | Burundi | Malta |
| 17 | Sri Lanka | Comoros |
| 18 | New Zealand | South Korea |
| 19 | Liberia | Saint Lucia |
| 20 | Côte d’Ivoire | Uruguay |
| 21 | Mauritius | Barbados |
| 22 | Eritrea | San Marino |
| 23 | Ghana | Finland |
| 24 | Comoros | Japan |
| 25 | Barbados | Bahamas |
| 26 | Seychelles | Yemen |
| 27 | Cameroon | Estonia |
| 28 | Singapore | Georgia |
| 29 | Madagascar | Jordan |
| 30 | Zambia | Denmark |
| 31 | Somalia | Iceland |
| 32 | Mauritania | Sri Lanka |
| 33 | Pakistan | Liechtenstein |
| 34 | Benin | Jamaica |
| 35 | Korea, Republic of | Bhutan |
| 36 | Nigeria | Germany |
| 37 | Sao Tome and Principe | Latvia |
| 38 | Equatorial Guinea | Lithuania |
| 39 | Australia | Hungary |
| 40 | Guinea | Ireland |
| 41 | Japan | Slovakia |
| 42 | Antigua and Barbuda | Norway |
| 43 | Malawi | Gambia |
| 44 | Uzbekistan | Togo |
| 45 | Cuba | Australia |
| 46 | Zimbabwe | Zambia |
| 47 | Mali | Austria |
| 48 | Afghanistan | Cyprus |
| 49 | Liechtenstein | Switzerland |
| 50 | Kazakhstan | Turkey |
| 51 | Bhutan | Slovenia |
| 52 | Azerbaijan | Eritrea |
| 53 | Malaysia | Antigua and Barbuda |
| 54 | Dominica | Mali |
| 55 | Haiti | Italy |
| 56 | Suriname | Monaco |
| 57 | Senegal | Sierra Leone |
| 58 | Tajikistan | Ghana |
| 59 | San Marino | Djibouti |
| 60 | Uruguay | Guinea |
| 61 | Congo | Nicaragua |
| 62 | Saudi Arabia | Cameroon |
| 63 | Gabon | Tajikistan |
| 64 | Eswatini | Morocco |
| 65 | Belarus | Benin |
| 66 | Rwanda | Poland |
| 67 | Kyrgyzstan | Somalia |
| 68 | South Sudan | Singapore |
| 69 | Turkey | Afghanistan |
| 70 | Germany | Belize |
| 71 | Guatemala | Sudan |
| 72 | Croatia | Serbia |
| 73 | Norway | Iran |
| 74 | Guinea-Bissau | Maldives |
| 75 | Chile | Zimbabwe |
| 76 | Cyprus | Luxembourg |
| 77 | Qatar | Guyana |
| 78 | Sierra Leone | Nepal |
| 79 | Venezuela (Bolivarian Republic of) | Haiti |
| 80 | South Africa | Qatar |
| 81 | El Salvador | Suriname |
| 82 | Finland | Belarus |
| 83 | Gambia | Pakistan |
| 84 | Monaco | Guinea-Bissau |
| 85 | Mexico | Chile |
| 86 | Switzerland | United Arab Emirates |
| 87 | Estonia | Czechia |
| 88 | Ecuador | Canada |
| 89 | Namibia | Croatia |
| 90 | Bangladesh | Portugal |
| 91 | Angola | South Sudan |
| 92 | Philippines | Kazakhstan |
| 93 | Italy | Kuwait |
| 94 | Romania | Spain |
| 95 | Colombia | Congo |
| 96 | Mozambique | Russia |
| 97 | United Arab Emirates | Bahrain |
| 98 | Malta | Moldova |
| 99 | Oman | Sao Tome and Principe |
| 100 | Luxembourg | Gabon |
Let’s look at how the positions have changed for the countries that were initially in the top 20 and countries that are now in the top 20.
Countries that dropped out of the top 20:
- Mauritius dropped from 6th place to 21st place.
- Malaysia dropped from 10th place to 53rd place.
- Cuba dropped from 12th place to 45th place.
- Malta dropped from 16th place to 98th place.
- Comoros dropped from 17th place to 24th place.
- South Korea dropped from 18th place to 35th place.
- Uruguay dropped from 20th place to 60th place.
- Uganda, Myanmar, Burkina Faso, Tunisia and Saint Lucia went from being at 9th, 11th, 13th, 14th and 19th place respectively to being unrated.
Countries that climbed into the top 20:
- Laos, Papua New Guinea, Brunei, Fiji, Egypt, Burundi, New Zealand, Liberia and Côte d’Ivoire went from being unrated to being at 1st, 6th, 11th, 12th, 13th, 16th, 18th, 19th and 20th place respectively.
- Yemen rose from 26th place to 15th place.
- Sri Lanka rose from 32nd place to 17th place.
It seems that several countries had difficulties holding on to a high control score while easily making way for other countries to steal their spot in the top 20.
Top Coronavirus controlling countries
The following Coronavirus controlling countries stayed in the top 20. For us, this stability is a clear indicator that they are ready to brace for the Covid-19 winter and might have a Coronavirus free Christmas if they manage well.
| Countries with high chances of a Coronavirus free Christmas | Ranking now | Ranking in June |
|---|---|---|
| Vietnam | 4 | 1 |
| Taiwan | 7 | 2 |
| China | 3 | 3 |
| Chad | 14 | 4 |
| Thailand | 10 | 5 |
| Niger | 5 | 7 |
| Cambodia | 2 | 8 |
| Mongolia | 8 | 15 |
| Saint Lucia | 12 | 19 |
Putting all nine of them together in one graph is an eyesore. So I’m splitting them into three graphs.
- Vietnam, Taiwan and China
2. Chad, Thailand and Niger
3. Cambodia, Mongolia and Saint Lucia
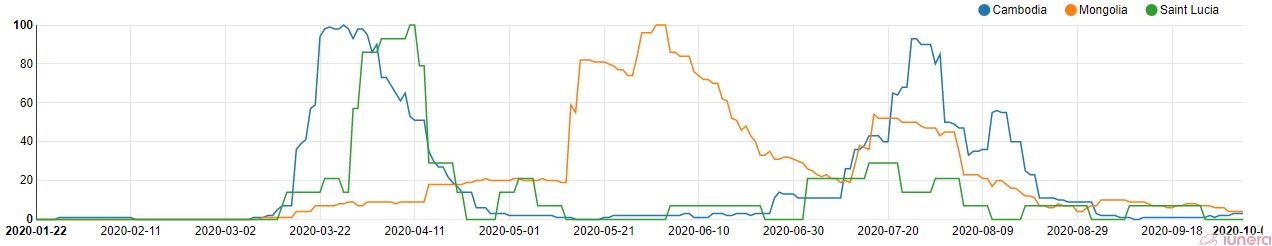
As of early October 2020, these nine countries showed one thing in common: low active percents. Their active percents are low now that their active Covid-19 cases are lower than before.
The author’s opinion about travelling with a second wave on the way
Honestly, I would put a blanket ban on travelling – especially internationally – and tell you to just wrap yourself up in a blanket at home.
Unless you have an important mission to accomplish, travelling is currently pointless, not worth risking our lives for and not a wise choice since people have to quarantine for up to two weeks, pay for their own quarantine costs in thousands, follow the rules, and thus, cannot enjoy themselves.
“Vietnam is not allowing entry or issuing visas to foreign nationals, from March 22 until further notice, except for those travelling for official or diplomatic purposes, who must undergo medical checks and 14-day quarantine upon arrival in Vietnam. These officials must pay for their own quarantine expenses as of September 1, 2020.
However, those whose visit is for less than 14 days are no longer required to quarantine, but they must comply with Vietnam’s regulations, including international health insurance and expenses covered by their sponsor organization.”
quote plucked from the official website of Vietnam National Administration of Tourism
And also, as a Malaysian born, bred and based in Malaysia, I can confirm that Malaysia is starting to become unsafe for travel now that the daily active cases are back to being 100-something.
Despite the health-prioritised standard operating procedures put in force in public spaces, a minor loosening in restrictions have led most people here to feel like it’s okay to go out and even disregard the social distancing rules. Some even felt the need to hold elections during this pandemic.
Also stating the obvious, Europe and North America are currently not safe for a carefree travel experience, mainly because of winter’s conduciveness to the coronavirus, regardless of the measures taken by these regions.
How can we survive this Covid-19 winter?
During the lockdown, most people took the measures very seriously. With the partial lockdown now, it’s the opposite. A little loosening in the lockdown restrictions and everyone’s like, “Oh, I can go out now. I can see my friends and family. I can do anything as long as I wear a mask.”
This mentality could perhaps be the reason the cases are increasing in some countries, proving that the world needs to go back to the level of seriousness they had during the lockdowns.
In order to survive this so-called Covid-19 winter wave, the Academy of Medical Sciences recommends:
- increasing capacity of the test-and-trace programme, to cope with the overlapping symptoms of coronavirus, flu and other winter infections
- getting more people vaccinated against flu
- ensuring hospitals and care homes have enough personal protective equipment (PPE)
- creating coronavirus-free zones in hospitals and care homes to halt infections
At the same time, socially-hungry people can host virtual parties and dates with each other since it gives the best of both worlds – socialising while social distancing in the best way.
The bottom line is the world needs to understand that re-opening the economy with conditions is different from going back to how people interacted pre-coronavirus.
“Opening up without having control is a recipe for disaster.”
WHO Director-General, Tedros Adhanom Ghebreyesus, said in his speech at the media briefing on Covid-19 in August.
Important questions
Why is it so crucial to control the Coronavirus?

– The lockdowns enforced to flatten the curve have resulted in a receding economy.
– Avoiding a second wave would help the economy get back up and minimise the health issues resulting from the first wave.
How can we compute the control score to rate how well countries are controlling Covid-19?

Control Score = activepercent × normalisedStability ÷ activeToPopulation1000
Whereby the variables are:
active cases = Total Infected – Cured – Deaths
activepercent = current active cases ÷ maximum number of cases
normalisedStability = log [(activepercent 28 days ago) – (current activepercent)]
activeToPopulation1000 = current active cases ÷ 1000 of the population
Which actions did high scoring countries take in the first wave?

– Cancelled outgoing flights
– Closed borders
– Implemented health checks at airports
– Contact tracing
– Strict lockdown conditions
– Awareness campaigns
– Quickly restocking and upscaling their test kits
How does winter increase the likelihood of Covid-19 infections?

– People gather indoors to escape the very cold weather, leading to a lack of social distancing.
– The coronavirus hangs around longer in drier air (lower humidity level).
What is one possible reason for a resurgence in Covid-19 infections in some equatorial countries?
Complacency as soon as their economies re-opened, despite the implementation of standard operating procedures in public spaces.
Why were several other countries unrated?

– Insufficient reporting of cured cases that are required to compute the numbers of active cases in these countries.
– The absolute numbers of active cases per day are still growing for these countries, more than before, which means that there is no turning point yet. The control score cannot be computed as long as the numbers of cases keep growing.
– The numbers in the last 28 days are fluctuating a lot, indicating that the situation is not stable at the moment.