
Remember Geography class?
This is not a nostalgia trip but it is very likely you owned an Atlas at one point. The book is synonymous with laying out how the world is structured geographically in the form of maps.
The Atlas also shows the topography, geographic and political boundaries of different regions in depth. An advanced Atlas also highlights the climatic, economic, social, and religious statistics of a particular region.
Well, the man we will learn more about in this piece — Gerardus Mercator — is credited with being the first person to apply the term Atlas to many maps compiled in book form.
Now, this brings us to the topic of the day — The Mercator Projection.
Gerardus Mercator & The Mercator Projection
The Mercator Projection is a cylindrical map projection pioneered by Flemish cartographer & geographer Gerardus Mercator in 1569. It was originally invented to exhibit compass bearings to aid seafarers in their travels.
This type of map projection is mainly used for nautical applications because of how seamless it is to denote lines of constant course otherwise known as “rhumb lines” as straight segments that preserve the angles along with the meridians.
Distortions
Despite the linear scale being equal in all directions across all points thus maintaining the shapes and angles of small projects, The Mercator Projection misrepresents the size of objects as the latitude advances to the poles from the equator, where the scale instantly becomes infinite.
One good example of the distortion caused by the Mercator Projection is that it projects Antarctica and Greenland to appear to be bigger than they actually are compared to land masses near the equator, most notably Central Africa.
Another distortion caused by the Mercator Projection is that it makes Greenland appear larger than Australia while in real-life Australia is at least three-and-a-half times bigger than Greenland.
Despite these weaknesses, the Mercator Projection became the de-facto map for nautical navigation mainly because it makes it easy for navigators to map out a straight-line course.
It is popular to this date because of this reason.
Western Bias
Critics have faulted The Mercator Projection for its Western bias. The argument is that both Europe and North America are bigger than they actually are relative to South America and Africa. As per the critics, this espouses white privilege and shows the world from a skewed perspective.
Due to these distortions, some experts opt for other representations including the Gall-Peters projection which is popular in the business and education fields.
However, there is no perfect representation as each one has its own weaknesses. The Gall-Peters projection for instance shows the fairly accurate size of nations and continents compared to each other but it is squashed along the poles and stretched at the equator.
How The Mercator Projection is Used
As mentioned above, The Mercator Projection is used for standard sea navigation. It is also applied for extensive mapping of areas near the equator namely Indonesia and bits of the Pacific Ocean. This is enabled by its rhumb lines feature.
The Mercator Projection’s variant —The Web Mercator projection— is ideal for online services and web maps.
It is instructive to note that, The Web Mercator projection is misused a lot of times for wall charts, thematic mapping on web maps, and world maps.
Equally Exciting Technology
Now that we have learned why The Mercator Projection is a gem to various professionals despite documented dissent from critics, let us take the time to learn more about other technologies.
Of particular interest are two technologies: The Esri ArcGIS Suite and OpenStreetMap.
Your most immediate question must be: Why do I need to know about this?
Well, the answers to that question are straightforward: The meteorologist responsible for studying and forecasting weather patterns uses Esri ArcGIS while OpenStreetMap (OSM) is a tech project that aims to capture every street, path, and other similar features on earth. You will learn how these technologies can save lives.
Esri ArcGIS
ArcGIS is a Geographic Information System (GIS) created by the Environmental Systems Research Institute (Esri). The system simplifies working with geographic information and maps.
The system is used to discover & share geographic information, populate geographic information in a database, develop and use maps & geographic information across a wide range of apps, assembling geographic data, and examine mapped information.
ArcGIS provides a platform to make geographic information and maps accessible by staff in an organization, in communities, and on the web. ArcGIS comprises the Windows software below: ArcReader, ArcGIS Desktop and ArcGIS Pro.
ArcReader
ArcReader is a mapping application that enables a user to check, navigate and print maps and globes. Anyone with this application can view top-quality interactive maps created by ArcMap and published via the ArcGIS Publisher.
Using ArcReader
Below are the first steps to using ArcReader.
To start ArcReader, hit the Windows Start button and click on ArcReader.
Opening an existing published map.
- Select file and click open
- Click on the drop-down menu and navigate to the map folder in the disk where the tutorial is installed
- For this example, select Angelus Oaks Recreation. pmf and click Open
ArcGIS Desktop
Referred to as ArcMap to differentiate it from ArcGIS Pro, it consists of four key applications:
ArcMap
Used to edit and view spatial data in two dimensions, hence generating two-dimensional maps.
Using ArcMap
In order to utilize ArcMap’s full potential, a user has to be familiar with the program’s interface.
Below are the first steps to using ArcMap.
- Run (start) ArcMap.
- Close the ArcMap-Getting Started Window.
3. Add data from ArcGIS Online via the standard toolbar.
ArcScene
Used to edit and view 3D spatial data in local projected view.
Using ArcScene
Below are steps to using ArcScene and opening ArcMap Data in 3D Google Data.
- Open ArcScene
2. Opened ArcScene
3. Adding TIN shapefiles to the project window
ArcGlobe
Used to visualize big, global 3D datasets.
Below are the first steps to using ArcGlobe.
Using ArcGlobe
- Open ArcGlobe and you will see a globe image similar to Google Earth.
2. Navigation controls — Global and Surface
The global mode is already set, hence making it easier for a user to pan as much as they would like in ArcMap. In surface mode, a user can tilt and instantly get oblique views.
3. Switching to surface mode
When you switch to surface mode, pressing down the left mouse button to pan and zoom, you will end up with a Google Earth-like image.
ArcCatalog
This program is used to manage GIS data alongside other manipulation tasks.
Below are the first steps on how to use ArcCatalog.
- Start ArcCatalog after which the ArcCatalog window will appear
2. The ArcCatalog window will give you a lowdown of how your data is organized
3. Look into the connection folder
Select a folder in the catalog connection enlisting. The items are shelved in the Contents Tab.
ArcGIS Pro
ArcGIS Pro is a GIS application designed to eventually supersede ArcMap and its companion programs. ArcGIS Pro is used in cartography both in 2D and 3D visualization. The product includes Artificial Intelligence (AI).
Using ArcGIS Pro
Below are the first steps to using ArcGIS Pro.
- Create new project
- Click on the new option and select the map prompt
3. For name, expunge the existing text and key in the location you want to work with
4. Click ok
Depending on the settings, the map generated may have a different default extent and base map. Consequently, it might differ from the image below.
ArcGIS History
Before developing the ArcGIS suite, Esri had concentrated its software development attention on the line Arc/INFO workstation as well as several other programs such as the ArcView GIS 3.x program.
Conversely, other ArcGIS products included MapObjects used by developers as a programming library and ArcSDE, a database management system.
These products did not integrate well with each other prompting Esri to rework its GIS platform in 1997 and create a single software that integrated all the functions of the former catalogue, making it easier for experts to use.
OpenStreetMap
OpenStreetMap (OSM) is a project designed to have a free geographic database of the world. The idea behind OpenStreetMap is to document every single feature on the face of the earth.
OSM is developed by a variety of contributors referred to as mappers, who collect data through conventional ways such as driving, cycling, or walking along paths and streets documenting their every move using Global Positioning System (GPS) receivers.
A large majority of mappers are volunteers who decide to contribute during their spare time although corporates, governments, and international institutions have recently started to contribute to the project.
The information is subsequently used to establish a collection of points and lines that can be converted into maps or used for navigation.
The original concept behind OpenStreetMap was to map streets, but in its current form, OSM has out-grown the original idea.
The project has been expanded to include buildings, footpaths, pipelines, waterways, trees, woodlands, postboxes, and beaches.
The project also lays out administrative boundaries and finer details such as bus routes.
Although the idea behind OSM is to gather geographic data, mappers have developed different software (most of it open source) that creates, manipulates or edits data.
OSM data is open for use by anyone for various reasons. The data is accessed under a license that allows a user to duplicate, alter and disseminate the data.
How OpenStreetMap is Applied
The idea behind OpenStreetMap is to have a rich pool of map data that can be applied in various ways.
Some of the ways OpenStreetMap data is applied include:
Maps
OpenStreetMap has opened the doors for people to get even more artistic by documenting or sharing graphically aesthetic and detailed maps, making it easier to map out a location or explain transport activity.
OSM has also been hailed as a game-changer for the humanitarian sector. In 2010, the technology was used by search and rescue teams after the Haiti Earthquake.
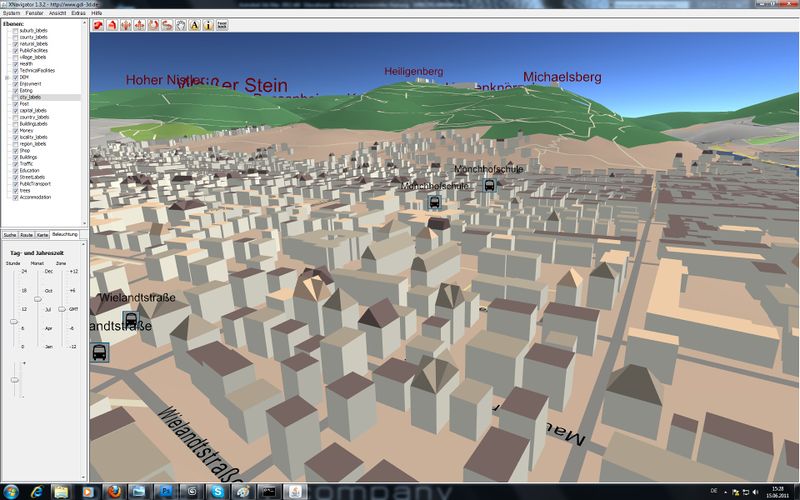
3D Maps
OpenStreetMap has made it seamless to incorporate detailed buildings and a lot of minor objects.
GIS Software
Most GIS software is subscription-based and expensive. On top of that, most of this software operates with data in an exclusive data format.
In contrast, OSM is free and supports interoperability, meaning people without access to such software can rely on OSM to perform some tasks.
Education
OpenStreetMap is used as an educational tool in schools i.e colleges and universities across different disciplines.
The technology is used to teach geography, maths, technology, community planning, and ecology.

Overpass Turbo
Overpass Turbo is a tool available online used to mine OpenStreetMap data.
Overpass Turbo runs on any sort of Overpass API query and displays the results via an interactive map.
Overpass Turbo was authored and is maintained by a Heidelberg Institute for Geoinformation Technology researcher named Martin Raifer. Its source code can be accessed on GitHub.
Use Cases for Overpass Turbo
Mappers
The Overpass API is popular with mappers as it is a great tool to filter OSM data.
It is used to:
- Probe place nodes spread evenly over large areas
- When a user only requires a filtered section of OSM data
- Search for infrequent spelling mistakes or breaks with naming conventions over a large region
- Displaying spatially large features such as rivers, boundaries or motorways and importing them directly into an editor
Developers
Developers use Overpass Turbo to:
- Create replicas of static or clickable maps spotlighting selected OSM features
- Refashioning OSM data to the geoJSON data make-up
- Developing and testing more or less sophisticated Overpass API queries
General Public
Overpass Turbo is used by ordinary citizens (non-experts) to filter out material they are looking for.
Gamers
Avid gamers are no strangers to Overpass Turbo as it was used in the famous mobile game Pokemon Go. Remember that game?
Well, Pokemon Go players use the tool to map out potential nests and spawns.
Technology is a Lifesaver… Quite Literally
In 2010, Haiti was hit by an earthquake that claimed the lives of 200,000 people and caused massive damage to the country’s infrastructure in addition to gutting the country’s economy.
Even so, in those situations, saving human lives is usually the priority.
By then, OpenStreetMap was proving to be a useful tool in navigating cities and towns that had been turned upside down and buildings reduced to rubble.
On one side: rescue experts — the other: A Haitian in need of help. In simple plain words, the technology could not have come at a better time.
The importance of this technology at that time cannot be understated. Going forward, technology will continue to be a lifesaver.