
Written by Natasha
In this article, we utilized the #NewNormal Big Data Analytics dashboard of Covid-19 data analysis to demonstrate how airlines can gain insight into possible air travel reactivation zones and routes for an effective Covid-19 airline recovery program.
Analysing Covid-19 impact progress and airline reactivation pathways
In this unprecedented and challenging time of the Coronavirus pandemic, data-driven insight into the rapidly unfolding situation is a crucial aspect for an effective Covid-19 airline recovery program. Decisions made on opinions, assumptions or guesswork will only cause further damage to the dwindling financial health of the airline industry and hence must be avoided at all costs.
Following hundreds of news reports every day from multiple sources worldwide in order to monitor the progress of the Coronavirus can be confusing, unreliable and not plausible for airlines. As a solution for this, we utilize the #NewNormal big data analytics dashboard which brings together and tracks all data points related to Covid-19 airline recovery in one single easy-to-use dashboard. This analysis aims to provide you with a glimpse into the data analysis and information possibilities available with this system for airlines.
The Covid-19 data analysis of identifying the possible and most profitable air travel routes to reactivate is a step by step task which includes the following steps respectively;
- Global-scale Analysis
- Regional Analysis
- Sub-Regional Analysis
- Country Analysis
- Flight Demand Analysis
Global scale Analysis
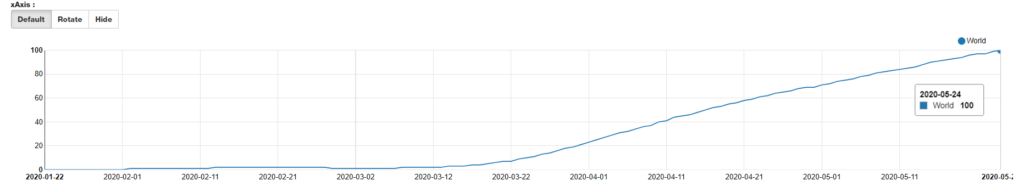
The above graph showcases the Covid-19 data analysis of the Coronavirus progress in the world from the start of the outbreak up until the 24th of May 2020.
The graph shows the active per cent of the world to be 100; the highest possible score. This indicates that the position of the world as a whole is still heavily impacted by the Covid- 19 Coronavirus; the infection rate is rising and many travel restrictions, especially air travel, are still very much in place.
Regional Analysis
The next step for airlines would be to examine the Covid-19 data analysis to identify if any and which regions of the world are performing better in terms of recovery.
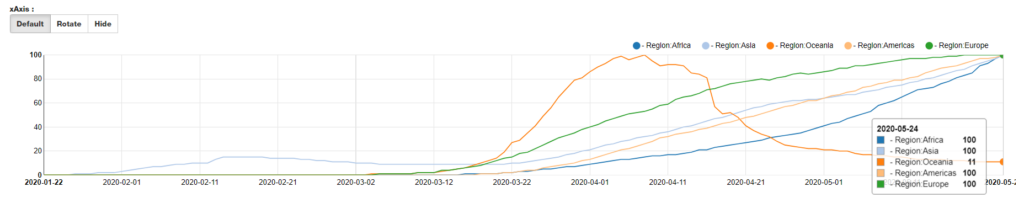
When comparing the progress and outlook of the 5 main regions of the world; Africa, Americas, Asia, Europe and Oceania, Oceania clearly shows to be the region with the most effective recovery path with an active per cent score of 11 points.
The remaining regions are still volatile with an active percent of 100, and yet to show signs of steady improvement.
Given this, airlines can expect to resume air travel in and between Oceania countries much sooner than most of the remaining parts of the world.
Sub-regional Analysis
In this analysis example, we chose to explore the European region instead of Oceania even though travel in and between the Oceania region will restart before Europe given the current outlook.
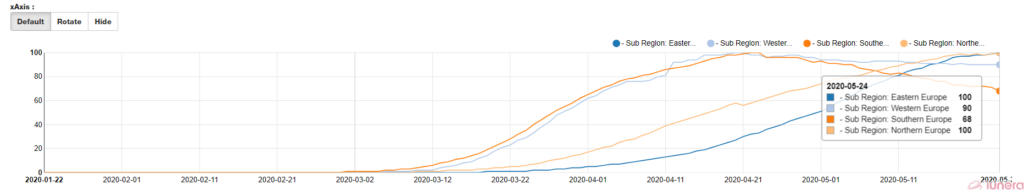
Europe has four regions: Northern, Southern, Western and Eastern Europe. When compared, Southern Europe showcases the best recovery progress with an active per cent of 68 points indicating that airlines can expect travel restrictions to relax and air travel to regain in Southern Europe sooner than the other regions.
Given this, airlines can now continue next to exploring which countries and routes in Southern Europe will be the safest to reactivate first in their Covid-19 airline recovery operations.
Country Analysis
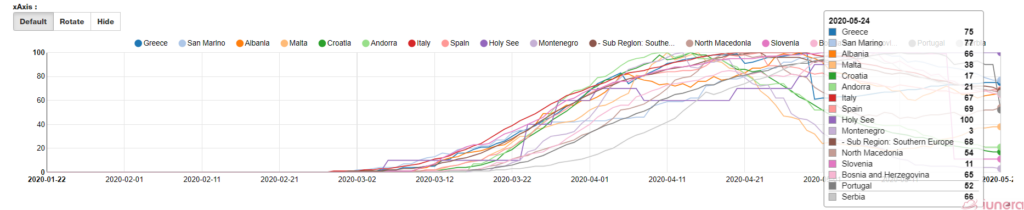
There are 15 countries categorized into the Southern European region. The graph demonstrates the recovery progress of all 15 countries. Among them, most regions show a steady recovery path however Montenegro, Slovenia, Croatia and Andorra show the highest improvement rate with active per cent scores of 3, 11,17 and 21 respectively.
Given this data analysis, airlines can expect to resume air travel in and between these 4 countries earliest in the entire southern European region.
Flight Demand Analysis
Once all possible reactivation zones and routes worldwide are identified, airlines should then identify flight demand for each route.
Flight demand will be inherently low during this time and well after due to the recession caused by the Covid-19 outbreak.
Even if airlines are able to identify all possible and safest routes to reactivate, it does not necessarily mean they should reactivate all of them at once. Instead, airlines should focus on identifying and reactivating the most in-demand routes first which will be the most profitable to operate during this time.
Using Big Data tracking and analytics, airlines will be able to identify which routes will have the most demand by logging their Website and App user behaviour data into the #NewNormal dashboard.
Conclusion
According to the data analytics, the Covid-19 Coronavirus impact at a global scale remains to be high as of 24th May 2020. Out of the 5 major regions in the world, Oceania shows signs of hope by displaying clear and optimistic recovery progress. This indicates that air travel will largely resume in the Oceania region well before the other regions.
However, airlines must not only focus on this region alone as there are other sub-regions and specific countries within the rest of the world that are showing promising results as well. To identify such sub-regions and countries, we chose to analyze the European region’s recovery progress.
Covid-19 data analysis of the European region and its 4 subregions; Northern, Southern, Western and Eastern Europe showcased that Southern Europe shows the most promising and effective recovery progress among the four sub-regions.
Within the Southern European sub-region, Montenegro, Slovenia, Croatia and Andorra are the 4 countries in the lead in terms of recovery which indicates that air-travel routes in and between these countries and other healthy countries identified worldwide can expect to resume sooner than most others.
Lastly, to identify which routes are the most profitable to re-open and operate, airlines should identify flight demand information for the selected routes. This is done by doc-ing and logging their web and app user behaviour data against the Coronavirus data in the #NewNormal dashboard.
Similar to this analysis, airlines can utilize the #NewNormal Big Data Analytics dashboard to gain important insights into all regions and countries in the world which will aid in an effective airline recovery action plan.
Are you looking for ways to get the best out of your data?
Let us help you use your data.