
Covid-19 is a pandemic deasaster. Governments issue and enfore time based movement control orders or contact restrictions for social distancing. Here we describe how and why telco mobile Big Data Analysis and Big Data Science can support the containment of Covid-19. Governments and researchers can use the description in this article on the implementation description as a template to implement Big Data Analytics dashboards to control effects of restrictions and to optimize resources. Thus, we believe our free mobile Big Data Analytics for Covid-19 guide can help beat the Coronavirus faster.
- Natural virus growth processes
- How social distancing stops the natural growth of Covid-19
- Problems with social distancing regulations
- Mobile Big Data analysis as solution
- Challenges in Mobile Big Data Analytics
- Solution: Mobile Big Time Series Data Analysis
- Conclusion
- Update (29th April 2021): Check out our latest project, Fahrbar!
- Related Posts
Natural virus growth processes
Without limitation and no basic immunity, Covid-19 spreads uncontrolled as normal natural growth process.
Research seems to have indicated that on average one person with the Coronavirus infects three more people.
Without any action the growth of infected people equals a logistic curve. At the beginning a few people are infected and over time the growth becomes exponential.
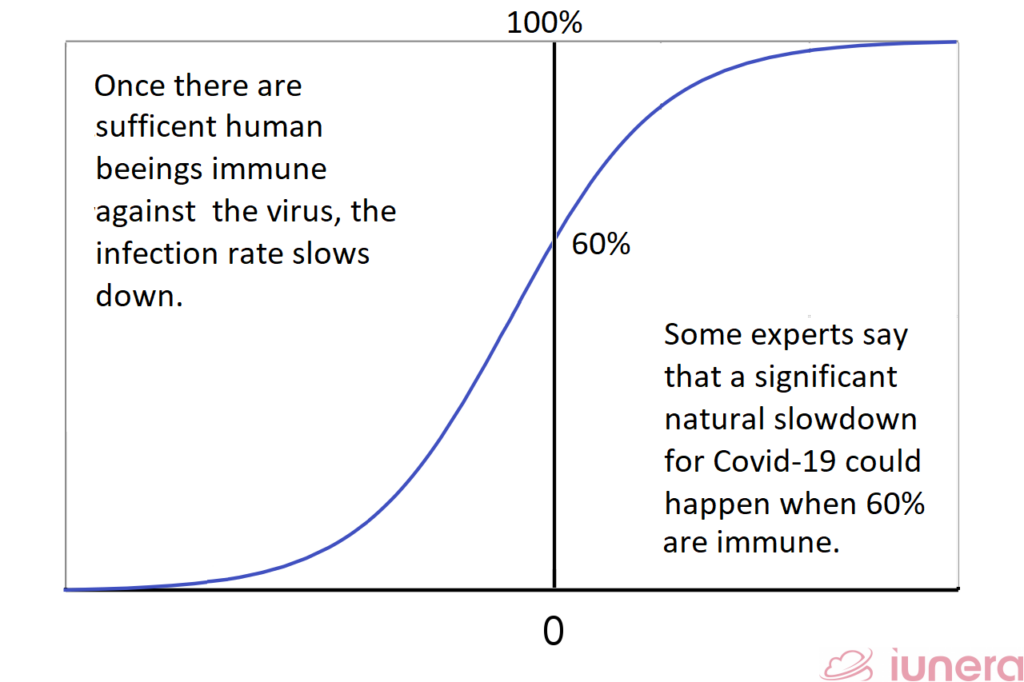
Once a certain amount of people have been infected and becomes immune against the Covid-19 or, once enough people are vaccinated, these people may not be able to spread the Coronavirus anymore when they get together with an infected carrier. This creates a certain kind of herd immunity where the immune people act as natural blockers for the Covid-19 spread.
The only way to protect another from Covid-19 today is to use collaborative approaches like social distancing and to improve hygiene until vaccines are available or herd immunity is reached.
How social distancing stops the natural growth of Covid-19
Until vaccines and treatmeants for Covid-19 are available, the only way for governments to limit the outbreak would be structural methods to contain the infection rate of the Coronavirus.
Social distancing, or physical distancing, is a set of infection control actions intended to stop or slow down the spread of a contagious disease. The objective of social distancing is to reduce the probability of contact between persons carrying an infection, and others who are not infected, so as to minimize disease transmission, morbidity and ultimately mortality.
https://en.wikipedia.org/wiki/Social_distancing
Social distancing is demanded and enforced by governments in different degrees to stop Covid-19. In some areas people are forbidden to go out of their flat, in other places people are allowed to go for a walk but not to meet up in groups larger than two people.
Problems with social distancing regulations
Governments of the world aim to slow down the Covid-19 spread by introducing movement restrictions in a lenient as possible way, to ensure a running economy.
Many people are responsible in trying to do their very best to contain Covid-19 by acting responsibly and limiting social contacts and movements to a minimum.
That said, there are people who still do not comply and the Coronavirus continues to spread. Therefore, goverments compare the new Covid-19 infections to the current measures and to decide in which geo-region actions are taken.
Decisions purely based on the Covid-19 infection rate might not help in optimizing these actions.
Imagine the following: Movement control orders with road blocks and traffic controls are introduced to slow down Covid-19 infections. This has several non optimal implictions:
- All regions where most people are staying at home will also be controlled where the resources could be used somewhere else
- Areas where people are moving consequently are hard to identify, this is because people might get infected away from their home
- Time based measurements of movements is impossible
- The time delay of the introduced measures will lead to citizen behaviour change are delayed based on the incubation period of the Coronavirus and the measurements
In short, by only relying on Covid-19 infection rate data, it would be hard to optimize controlling rules. Additionaly, the results of the rules and the control work is delayed for days.
Mobile Big Data analysis as solution
The infection rate of Covid-19 as a sole data source is not sufficent to control the movement and restrictions efficently. One way for optimization is to use the provider data for mobile big data analysis as additional data source.
Mobile networks work as follows: Mobile phones connect to a primary cell tower. Therefore, they are able to identify the cell towers which are near them, too. Once a customer moves in another area a new cell tower offering stronger connection takes over.
Thus a smartphone and the mobile provider knows which cell towers are around a smartphone and how strong the signal is. The following graphic visualizes this.
Cell-tower Time Series Data
We can imagine the cell tower data connects with a devices like in the following table.
| Time | Global Cell ID | GPS position | Device ID | Signal |
| 30.03.2020-09:00 GMT | 1212121212 | 49.2949829,8.6468474 | 1337 | -86 dB |
| 30.03.2020-09:00 GMT | 1414141414 | 49.3034692,8.6495268 | 1337 | -71 dB |
| 30.03.2020-10:00 GMT | 1515151515 | 49.2962575,8.7123103 | 1337 | -60 dB |
| 30.03.2020-10:00 GMT | 1414141414 | 49.2949829,8.6468474 | 1337 | -77 dB |
We see time series data of the device 1337 which exchanges at 09:00 data packages with the cell tower 1212121212 and 1414141414. At 10:00 the device is not in range of 1212121212 anymore and is now seen by 1515151515.
Imagine now to collect an immense volume of mobile cell tower data to store this time series in an apporiate way for time series analysis.
Challenges in Mobile Big Data Analytics
One can now try to do triangulations of the location of a device and build a database of signal strength and then try to compute the movement. Today, some mobile providers proclaim they can track in certain areas down to 100 square meters.
However, researchers say reality of geo-location is not so simple and there are challenges to compute movements.
One can imagine the challenges also very simply, by considering a walk through a house. At the top floor the signal strength will likely be best and multiple cell towers are recieved whereby in the cellar only the strongest bar or even none is received. It will be very hard to separate all of these readings and additional similar cases to get details about real movements.
Let us reassess if all of these scientific challenges can really overcome the reach to our goal.
Looking more closely, we can see that the use case does not per se demand that we know the exact geo-locations and how the movements are made, we only need to determine if the movement behaviour changes through a govenment order and control.
Research reveals insights about behaviour pattern from cell tower data by mining daily behaviour patterns. Daily movement routines like going to work can be extrapolated. This research can then be applied and a before and after comparison of behaviour can be made.
The down side of applying this approach is that, a certain data set of an individual is needed to extrapolate the patterns. When govenments tighten movements by rules, home office happens becomes more commonplace or just the awareness of an individuals change it takes (some time) till the new patterns are minable.
Another downside is that the movement routines of individuals are known and this is directly a data privacy issue.
Additionally, the approach to trace individuales does not target the main question:
Do the movement or contact restrictions lead to behaviour change in the society?
The question is what the vast corpus of society is doing and not the specific indivudual.
Therefore, we propose a simple approach of applying mobile Big Data Analysis for the Covid-19 movement control in the following.
Solution: Mobile Big Time Series Data Analysis
We propose a Big Data Architecture aligning to the process in the following:
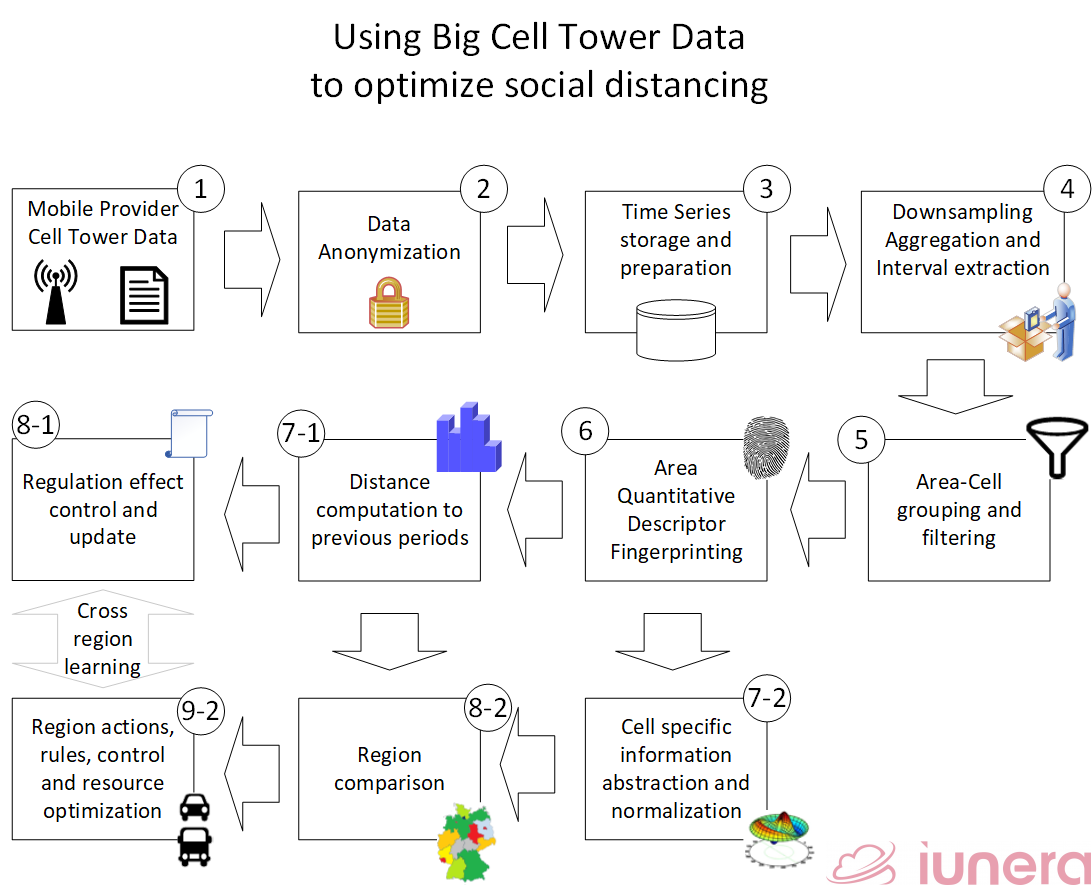
In summary, the process in the process is consists of the following steps:
1. Data capturing of a mobile provider
The mobile provider has details of which devices were discovered by the different cell towers and when. This data is then stored and used to do Big Data Analysis for Covid-19 movement control as described in the next step.
2. Anonymizing Data for Privacy
The data is stripped from identifiable user information. Values like user identifiers are best replaced by hashes with a salt. The salt should therefore be changed for analysis intervals and to avoid a direct user focus in the following analysis and to stay privacy-compliant.
3. Time Series Data transformation and persistence
The anonymized data is now transformed and stored in a Time Series Database. The transformation preparation is necessary to align and flatten the data for analysis.
4. Aggregation, Downsampling and interval extraction
The Time Series Database is queried and used for downsample and filter the fine grained connection data for the needed intervals.
By downsampling the aggregation function is used to compute representative values of the signal strength within the timeframe.
Let us look at an example:
Let us imagine the readings in the following table. Here a device was discovered by two different cell towers.
| Time | Anonymized Device identfier | Cell Tower ID | Signal dB |
|---|---|---|---|
| 09:09 | 12121212 | 11111 | -86 |
| 09:10 | 12121212 | 11111 | -60 |
| 09:12 | 12121212 | 11111 | -81 |
| 09:12 | 12121212 | 22222 | -72 |
| 09:14 | 12121212 | 22222 | -69 |
| 09:24 | 12121212 | 11111 | -89 |
| 09:42 | 12121212 | 11111 | -82 |
| 09:45 | 12121212 | 11111 | -73 |
| 09:45 | 12121212 | 22222 | -71 |
We see that the signal strengh varies. Therefore, we provide a downsample of an hour’s readings with a histogram aggregation function that we show in the following. There the signal strength is classified in different levels and we see how often measurements of this levels appear.
| Time 09:00-09:59 Cell tower | Device identfier | Strength Level 3 -(60 – 69) dB | Strength Level 2 -(70 – 99) dB | Strength Level 1 -(80 – 89) dB |
|---|---|---|---|---|
| 11111 | 12121212 | 1 | 1 | 4 |
| 22222 | 12121212 | 1 | 2 | 0 |
We see that the histogram aggregation makes it possible to describe the record simplified as follows.
| Time | Cell tower | Device identfier | Signal Strength |
|---|---|---|---|
| 09:00-09:59 | 11111 | 12121212 | 1 |
| 09:00-09:59 | 22222 | 12121212 | 2 |
| 10:00-10:59 | ….. | … |
Now one needs to imagine that 24 hours are listed in such a table, indicating how well signals were recieved.
5. Area cell grouping and filtering
Regions with one or more cell towers are specified. These regions act then as criteria to associate signal measurements with them.
Thereby regions are defined by logical conditions which cell towers need to be recieved. In addition signal strength levels can be defined to match a region. We show an example in the following table.
| Region | Filter cell towers (AND, OR, WITHOUT, Required strength) |
|---|---|
| Village – A | AND (11111, 22222) |
| Village – B | AND (22222, 33333) |
| Village – C | AND (33333, 44444) |
6. Area quantitative descriptor fingerprinting
Creating a fingerprint is the combination of the area cell definition of step 5 and the downsampled data of step 4.
A descriptor is a representation of a pattern of how strong signals were recieved in an area throughout a day.
We show one way to compute a desciptor in an example:
| Region | Time | Device | Region Tower 1 – strength level sum | Region Tower 2 – strength level sum |
|---|---|---|---|---|
| Village – A | 09:00-09:59 | 12121212 | 1 | 2 |
| Village – A | 10:00-10:59 | … | … | … |
The concrete towers of a region are generalized and arranged in columns and the strength is put into the cells. The region defintion is used as foundation to filter the values.
We see that Village B is not shown eventhough the device 12121212 has recieved a signal of a cell tower from village B, because the condition was that both cell towers need to be recived.
One the time period is long enough there is a complete pattern of cell phones at a certain point of time in a region.
7-1. Distance computation
Once the descriptors are computed they can be used to compare days and the movement activtiy into a scalar value. Different ways to compute such distances are possible and we show one in the following.
Let us assume readings for two days. Between 11:00 and 11:59 the device is only seen on the first day.
| Region | Time | Day | Device | Tower 1 – Strength Level | Tower 2 – Strength Level |
|---|---|---|---|---|---|
| Village – A | 09:00-09:59 | 1 | 12121212 | 1 | 2 |
| Village – A | 10:00-10:59 | 1 | 12121212 | 2 | 3 |
| Village – A | 11:00-11:59 | 1 | 12121212 | 1 | 1 |
| Village – A | 09:00-09:59 | 2 | 12121212 | 2 | 2 |
| Village – A | 10:00-10:59 | 2 | 12121212 | 2 | 2 |
| Village – A | 11:00-11:59 | 2 | 12121212 | – | – |
We can now compute a simple distance of the readings for a device.
| Device: 12121212 Region Village A | Tower 1 | Tower 2 | Abs Sum |
|---|---|---|---|
| 09:00-09:59 | Day 1 – Day 2 =1-2=-1 | Day 1 – Day 2 =2-2=0 | 1 |
| 10:00-10:59 | Day 1 – Day 2 =2-2=0 | Day 1 – Day 2 =3-2=1 | 1 |
| 11:00-11:59 | Day 1 – Day 2 =1-N/A=1 | Day 1 – Day 2 =1-N/A=1 | 2 |
All in all, we see now a distance of 4 which indicates how strong the movements in a region or outside would likely have been.
Now, we can compute values of the movement strength between normal days and compare this absolute value between those days. We can then compute the movement strength between the days where govenment policies have been set in place and see if the movement value lowered and how much.
8-1 Regulation effect control and update
Once the indication of how much movements in different time intervals are compared, one sees if the movement goes up or down. This can be used by goverments to lift or tighten movement rules that are used for Covid-19 containment.
7-2 Abstraction and normalization
The information from different regions is abstracted and used to compute normalization values for different regions.
Different normalizations are possible. An easy one is to apply a logarithmic scale to the computed scalar movements from a region. Alternatively, a complete data driven approach can be done.
An example how data can serve as foundation for a normalization, we see the following table. There region A and B have a different number of active devices with a different strength level and active devices during a measurement period.
| Region | Amount of active devices during a period | Sum of strength level |
|---|---|---|
| Village – A | 4 | 6 |
| Village – B | 3 | 9 |
A normalization factor from this data can be used to divide by the sum of the signal strength and then by the number of devices.
8-2 Region comparison
The values form 7-1 are taken and then a normalization gets applied.
We show an example of movement values of two regions and normalize them to have a comparable value.
| Region | Movement value day 1 to 2 | Normalization factor | Normalized value |
|---|---|---|---|
| A | 32 | 4*6=24 | 32/24=1.33 |
| B | 35 | 3*9=27 | 35/27=1.29 |
9-2 Region control and resource optimization
Once the prior steps have revealed which regions have the most movements, resources can be deployed in more optimal ways.
Imagine there is a region where not much movement is appearing since the beginning of the pandemic. Maybe there are no form of restrictions neded and the resources for controlling and restricting this region can be lifted and better deployed in another region that is in comparison worse.
Cross region learning
Last but not least the experiences of different Covid-19 regions which policies, regulations and which control were applied can now be compared with mobile signal analytics by using Big Time Series Databases.
Mobile Big Data Analysis makes it possible to compare how different movement regulations in which regions works in which way respective to the movements of citizens.
This enables learning which restrictions and controls lead to the results where movement and therefore containment in a geo-region of Covid-19 works best. This way, different regions can more easy be learnt from another.
Conclusion
We’ve got insights about the natural Covid-19 growth process and explained how social distancing helps to contain Covid-19. The time delay between governments actions and the changing infection rates illustrates the need for other data sources to fight Covid-19 more efficently.
A disussion about the cell tower data underlined the case that cell-tower mobile Big Data Analysis can support giving coarse grained insights about movements to slowdown Covid-19.
Ultimately, we presented an approach on how mobile provider data can be privacy compliant anonymized and then processed with Big Data analysis tools like Time series Databases.
Our complete mobile Big Data Analytics for Covid-19 guide described how the data is exactly processed with Big Data analysis tools.
We have illustrated how movement information can be extracted and leveraged to quantify changes in movement behaviour of citizens into indicators. On top of this, we gave detailed insights and examples of the needed computations and which data features are serving as foundation for computing these indicators.
All in all, our proposed mobile Big Data Analysis for Covid-19 helps receive insights about movement behaviour changes. The number based indicators now allow to compare regions or to optimizes actions, resources, controls and regulations in regions to help slowing down Covid-19 cases.
Now, governments and researchers can use our structured process, examples and description as a template to implement Big Data Analysis dashboards on how citizens react to the lowering and increasing of movement restrictions and where the problem zones are.
We further believe that there are ways to fine tune and advance our described mobile big time series data analysis. Hence, we see our proposed approach only as the first step before even further advancements can be done.
The goal of our herein shared description is that it can serve as an easy starting process, leading to first results, and improving and aliging the analytics for the special country where it is applied.
We hope that this description eases data driven enthusiasts to support governments to limit the implications and restrictions of the Coronavirus/Covid-19 crises.
A pandemic is a global team effort. In case you have additional details which can help and which should be included in the article – please let us know.
Update (29th April 2021): Check out our latest project, Fahrbar!
Get in touch with us
If you are interested in Fahrbar or want to find out how we can help you leverage your data