

This article explores the concept of Sovereign AI and introduces Data Philter, an open-source, local-first AI […]
While Apache Druid offers unparalleled real-time analytics, its operational complexity often creates a significant bottleneck for data teams. This article introduces the iunera Druid MCP Server, a revolutionary open-source tool that builds a conversational bridge to Druid's powerful engine. Learn how it leverages a Large Language Model (LLM) and the Model Context Protocol (MCP) to translate simple, natural language commands into complex data workflows, removing operational overhead and making advanced analytics accessible to everyone.

Revolutionize enterprise AI with agentic RAGs. This guide explores a 15-step pipeline and offers insights for enterprise AI implementation.
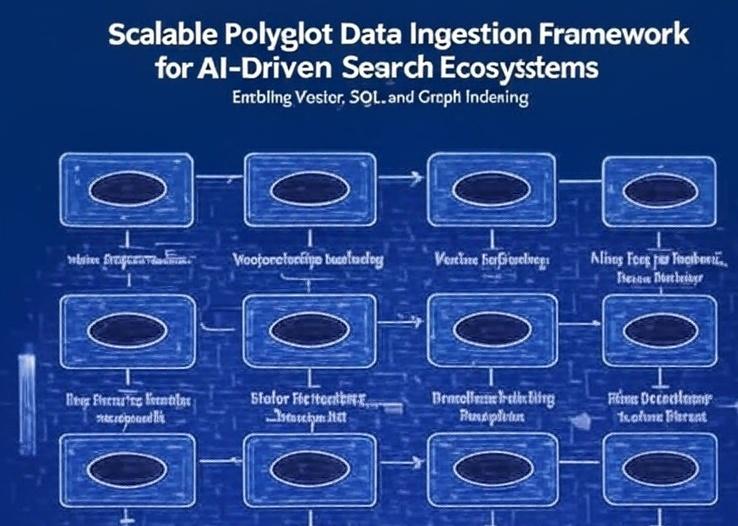
Explore a scalable polyglot data ingestion framework for AI-driven search ecosystems, supporting vector, SQL, and graph indexing. A flowchart details 6 steps for preprocessing and embedding, enabling robust RAG search.